Debugging with IDB
Objective
Background of this item: when the model does not run as expected, the calculations will need to be checked step by step. Debuggers such as IDB help to identify what are the values taken by some variables at some point, check that a subroutine of interest is actually called during the execution of the code (and how many times it happens),... This might be very useful when one would like to speed up the identification of the variable which is the first to take weird values (particularly after a significant modification of the code) and the snap of code which cause that trouble. An basic alternative to the use of debuggers is added WRITE statements to the code.
Boundary conditions for using a debugger
Of course, getting a functional version of the code after a modification of one of the routine of ORCHIDEE continues to require a few steps and the debugger we present only helps to speed up the second one :
- Getting a version of the code which can be compiled. The first errors displayed by the compiler before crashing should be of some help to solve that issue.
- Once the code including the modification can be compiled properly, it may often happen that some of the variables take aberrant values, even for runs in offline mode on one point. You are likely to be interested by this tutorial if you are used to proceed to tedious cycles of :
- addition within the subroutine of interest of lines such as "PRINT *, 'MY_VAR='my_var
- compilation of the code
- screening of the standard output of the executed code
- Check that the introduction of the new feature doesn't lead to weird behaviour for runs at the global scales and/or coupled with the GCM.
IDB on obelix
Authors: P. Brender
Last revision: J. Ghattas (2019/05/02)
Activate the debug flags when compiling the orchidee_ol executable
The goal of this step is to include marks within the executable which let the debugger identify which line of the source code is processed at every step of the execution. Follow the explanations for compiling ORCHIDEE, XIOS and IOIPSL in debug mode at following page How to get starting debugging.
Launch the executable within the debugger
Start the executable from the folder of your choice within which you have added a run.def file with all the options of your choice and information about the location of the forcing files, the restart files,... In the present example, we will run the code unto the first execution of line 278 of sechiba.f90, print the value of all the variables defined at that point, continue until the next execution of that line, print again the value of lai_max and then finish the execution of orchidee_ol.
First, we copy the newly compiled executable (see above) in the execution folder. Check that all the restart and forcing files are correctly referred to in the run.def and make sure that all restart files of the previous run have been removed from the source folder.
user@computer:~/my_execution_folder>cp ~/my_orchidee_install/bin/orchidee_ol .
user@computer:~/my_execution_folder>ls -l
orchidee_ol   run.def driver_start.nc sechiba_start.nc stomate_start.nc
Then launch the executable within the environment of the debugger. If you are within the lab, it might be nicer to use the graphical interface environment. Type :
user@computer:~/my_execution_folder>idb ./orchidee_ol
Intel(R) Debugger for applications running on Intel(R) 64
Reading symbols from ~/my_execution_folder/orchidee_ol...done.
From outside the lab, it is more efficient to use only the command line :
user@computer:~/my_execution_folder>idbc ./orchidee_ol
We set a first breakpoint (line of the code at which we want the execution to halt) and run the executable to that point. Here we added a condition on a variable (kjit) to stop only when the time-step kjit==5800 is reached.
(idb)break sechiba.f90:278 if (kjit == 5800)
(idb)run
Then we have a look at all the variable defined within the present subroutine
(idb)print lai_max
...continue the execution of the code step by step :
(idb)step
Look at the evolution of the variable after each stop in the iteration :
(idb)display lai_max
...look at the code around the current position
(idb)list
Now we can change the condition on 'kjit' for the first breakpoint (the only defined as can be checked by running info b or info break). Then, we continue the execution of the code until the new condition is matched :
(idb)cond 1 (kjit==5900)
(idb)cont
We could also simply remove this condition and continue the execution of the code until the next execution of the line 278 of sechiba.f90 :
(idb)cond 1
(idb)cont
show the list of breakpoints
(idb)info breakpoints
...remove all breakpoints to finish the execution of the code and quit the debugger
(idb)delete break
(idb)cont
(idb)quit
user@computer:~/my_execution_folder>
user@computer:~/my_execution_folder>ls -l
orchidee_ol   run.def driver_start.nc sechiba_start.nc stomate_start.nc driver_restart.nc sechiba_restart.nc stomate_restart.nc out_orchidee.txt
...and one may start again from the beginning after having removed the restart files
user@computer:~/my_execution_folder>rm -f *restart.nc
user@computer:~/my_execution_folder>idb ./orcdidee_ol
Rather than leaving the debugger and coming again, we could have rm the restart files from inside and start again the execution from the beginning :
(idb)shell rm -f *restart.nc
(idb)run
Note also that shortcuts do exist for most of the commands (r for run, s for step, b for breakpoint,...). Using it further speeds things a little bit.
Other elements of syntax
- In line help
- general menu
(idb)help
- on a precise command
(idb)help info
- or subcommand
(idb)help info breakpoints
- general menu
- List
- all the available commands
(idb)complete
- all the commands starting with a defined subcommand
(idb)complete info
- local variables defined at different level of the call stack (for exemple in dim2_driver, which is always the outermost (frame -1) or the inner one, for instance sechiba.f90 if we have just stopped at the breakpoint defined above.
(idb)bt
(idb)frame 1
(idb)info locals
(idb)frame 0
(idb)info locals
- all the available commands
- Magic
- Change the value of one variable and continue the run afterwards to check if it solve all the problems.
(idb)set variable fluxsens(1)=1
- Change the value of one variable and continue the run afterwards to check if it solve all the problems.
- Similarity with gdb
By default, idb actually use the very same syntax as gdb but may also be used with an other syntax, when launched with the -dbx option. The two are pretty similar. Simply beware of that when you copy snapshot on forums,...
Ex of diff :
idbc -gdb
(idb)set variable fluxsens(1)=1
idbc -dbx
(idb)assign fluxsens(1)=1
- Reference sheet
A nice list of reference for using gdb and idb (in -gdb mode, the default, as explained in the syntax paragraph): Quick reference sheet. Also available on the net http://www.scribd.com/doc/3589/gdb-quickrefSyntax But gdb is not working too well on code compiled with ifort, use idbc in these situations.
Attachments (7)
-
gdb-quickref.pdf
(74.8 KB) -
added by luyssaert 13 years ago.
Quick refere,nce to IDB syntax
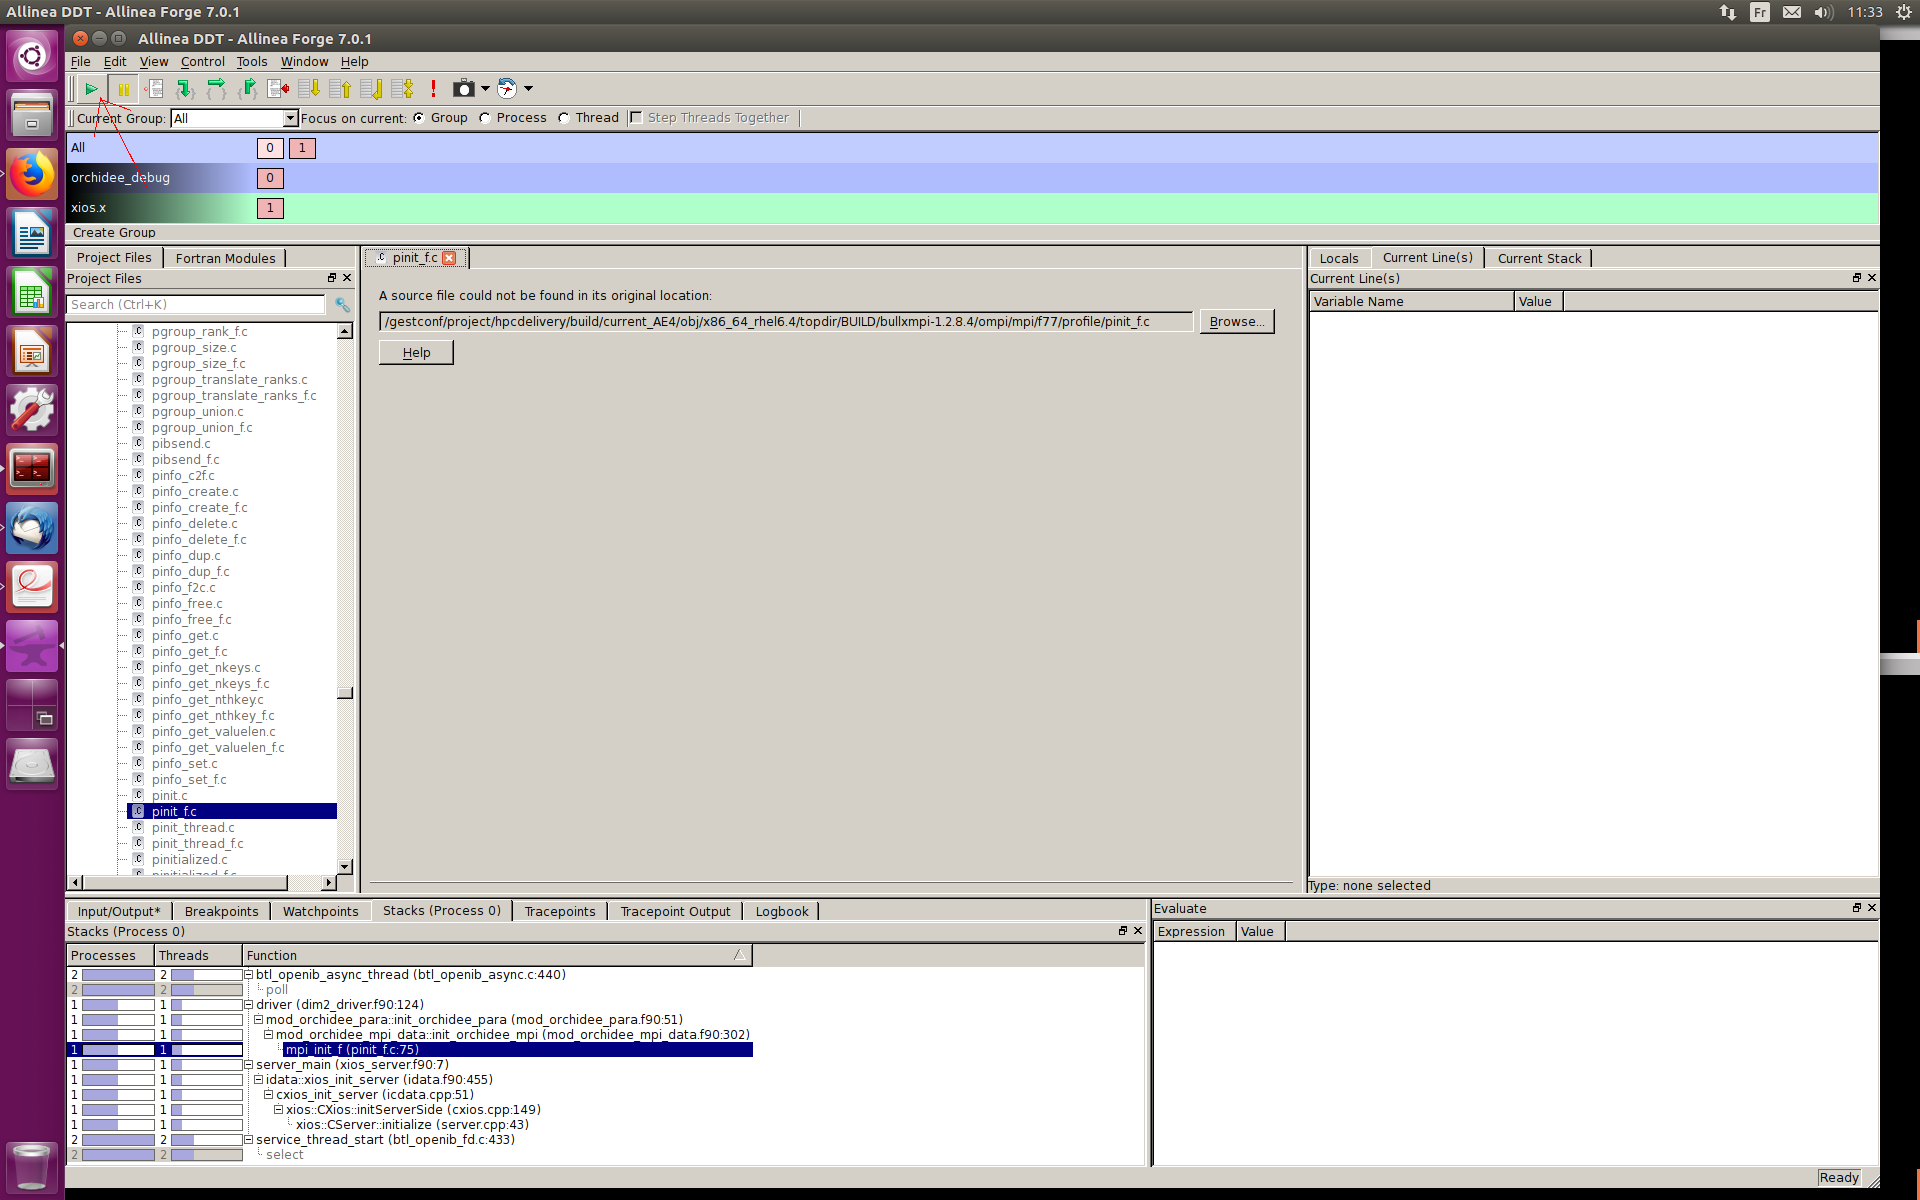
- ddt_main_debug_arrow (186.7 KB) - added by ajornet 7 years ago.
- ddt_mpmd_debug_setup_arrow (199.2 KB) - added by ajornet 7 years ago.
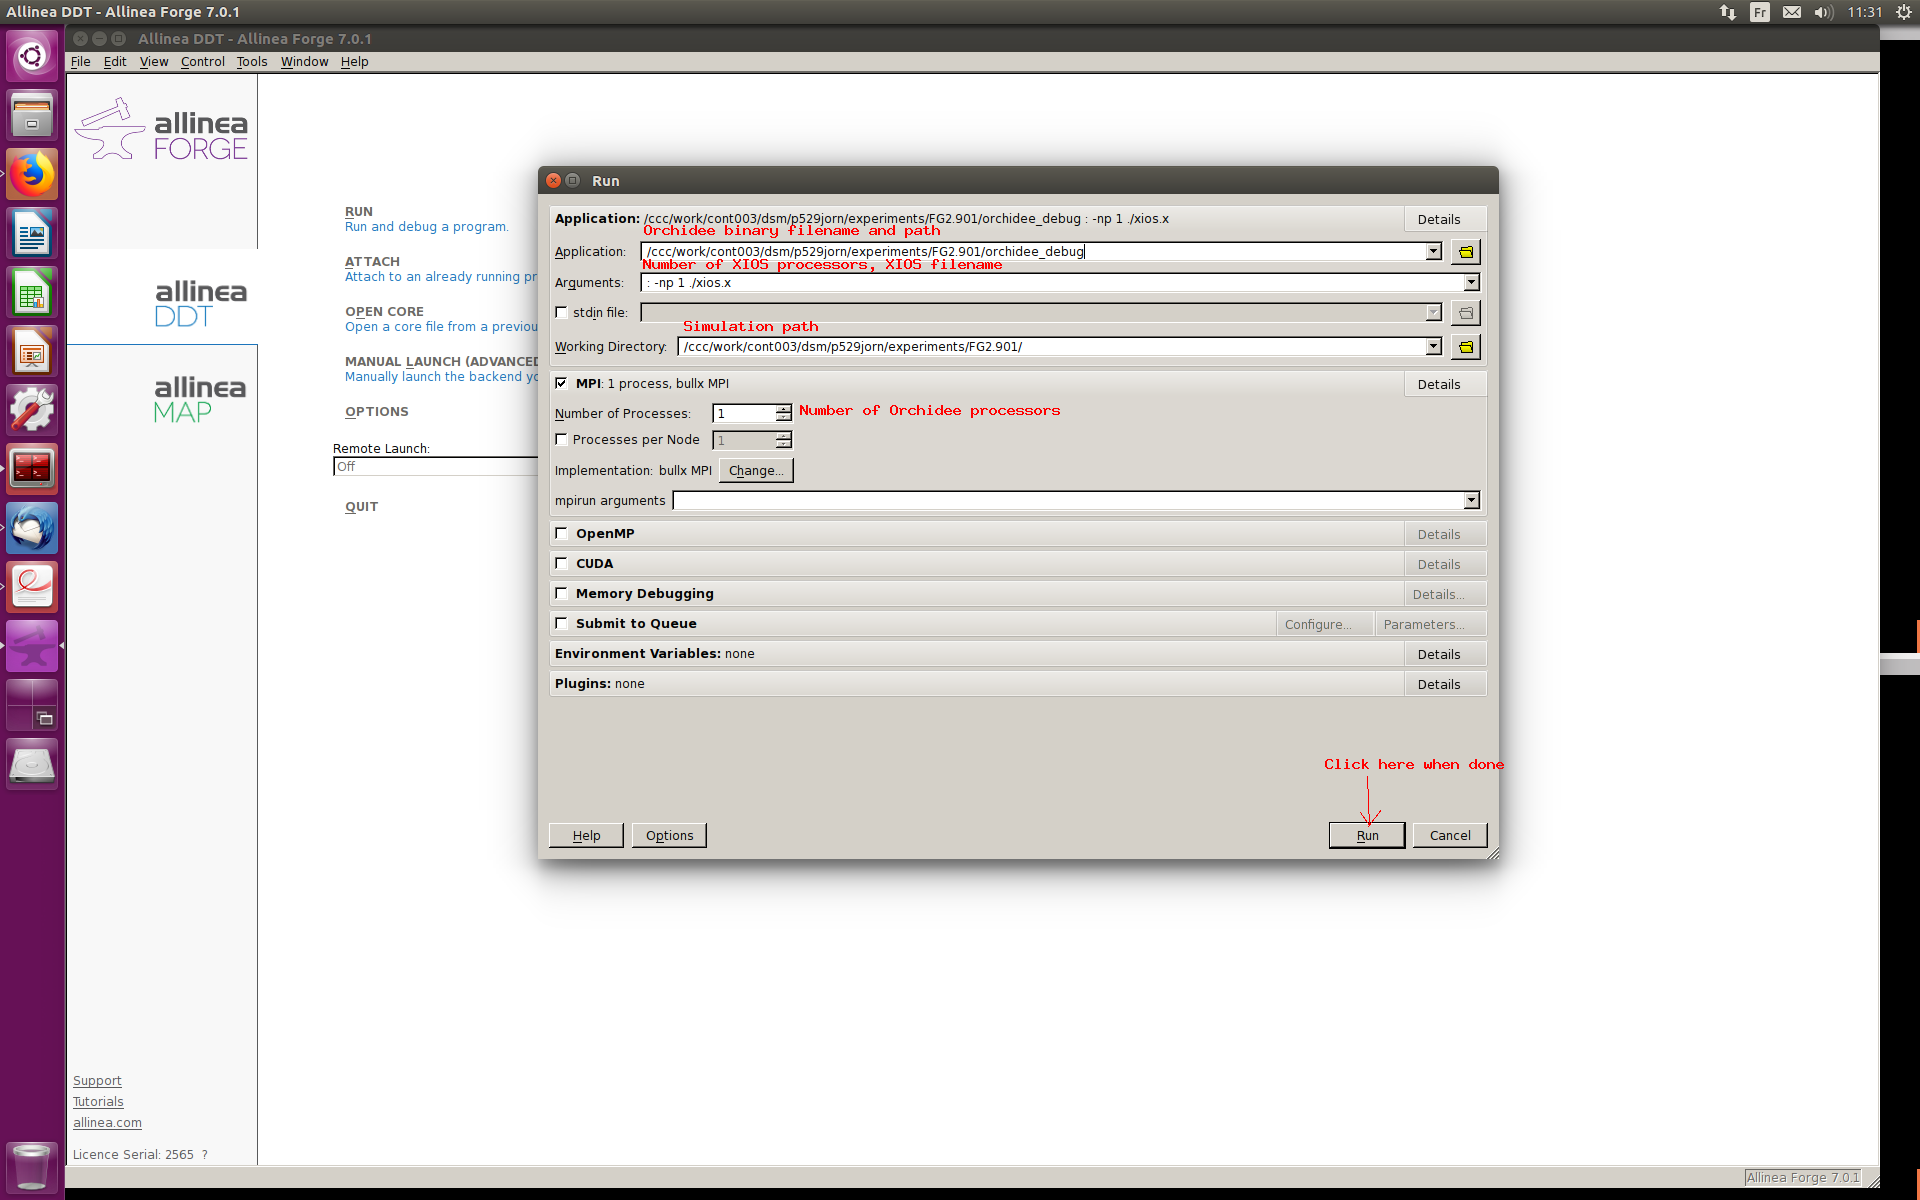
- ddt_click_run_arrow (230.8 KB) - added by ajornet 7 years ago.
- ddt_mpmd_debug_setup_arrow.png (199.2 KB) - added by ajornet 7 years ago.
- ddt_click_run_arrow.png (230.8 KB) - added by ajornet 7 years ago.
- ddt_main_debug_arrow.png (186.7 KB) - added by ajornet 7 years ago.
Download all attachments as: .zip