| Version 12 (modified by msaad, 5 years ago) (diff) |
|---|
Emission factors
- Janssens et al., 2015: HTAP_v2.2: a mosaic of regional and global emission grid maps for2008 and 2010 to study hemispheric transport of air pollution
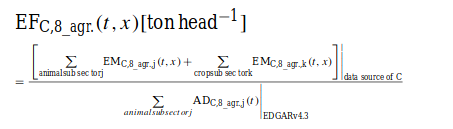
The region-specific implied emission factors (EFs) present the emissions per 1000 head of animals for agricultural related activities, are defined for a substance x at year t (htap_8_AGRICULTURE) in a country C as follows:

The emissions of the htap_8_AGRICULTURE sector are weighted with the number of animals and not with the kton crops cultivated, because the crops serve for 85 % as animal food and are therefore considered a justified measure of agricultural activity.

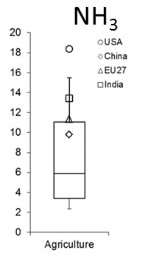
Implied emissions factors (ton head−1) for the year 2010 for NH3.
For NH3 a relative difference of+17 % is acceptable because of the larger uncertainty in emission factors driven by lack of information about manure management practices and also by incomplete data on the agricultural activities
- Crippa et al., 2018: Gridded emissions of air pollutants for the period1970–2012 within EDGAR v4.3.2
Implied emission factors can be used as a metric of emission intensity of anthropogenic activities for each country,and they have been calculated following the methodology by Janssens-Maenhout et al. (2015)
The emission factors used in EDGAR are mainly based on the EMEP/EEA (2013) guidebook and partly on the latest available scientific knowledge (EMEP/EEA, 2016; see guidebook). When information on EFs is missing or very uncertain (e.g. for Africancountries), default emission factors are considered to keep the consistency and comparability of the emissions among countries.
The uncertainty of NH3 is the largest among all pollutants because of the high uncertainty of both agricultural statistics and emission factors (range of variation in 2012: 186 % and 294.4 %).
| world median | 2.4E-01 |
| EU28 median | 1.3E-01 |
| USA | 1.6E-01 |
| China | 8.3E-02 |
| India | 4.8E-01 |
| Russia | 8.0E-02 |
| Japan | 5.4E-04 |
Implied EFs (t/thousand heads) for agricultural sector for selected regions and the world in 2010.
- Hoesly et al.,2017: Historical (1750–2014): anthropogenic emissions of reactive gasesand aerosols from the Community Emissions Data System (CEDS)
EDGAR is used as the primary scaling inventory as well as gridding data proxies. Non combustion emissions estimates are taken from both EDGAR and the country inventories. Inventory values are gap filled and extended back to 1970 following EDGAR trends (most country inventories do not extend back to 1970, the starting point of the EDGAR data).
For agricultural emissions, the actual practices of managing livestock manures will affect true emissions; such practices vary significantly across the world but are not always well understood or reflected in the emission factors used in global inventories (Paulot et al., 2014).
- Riddick et al.,2015: Estimate of changes in agricultural terrestrial nitrogen pathways and ammonia emissions from 1850 to present in the Community Earth System Model
Attachments (4)
- EM.png (8.4 KB) - added by msaad 5 years ago.
- EM1.png (13.7 KB) - added by msaad 5 years ago.
- EM2.png (8.6 KB) - added by msaad 5 years ago.
- EM3.png (5.3 KB) - added by msaad 5 years ago.
Download all attachments as: .zip