Emission factors
- EDGAR inventory
The emission factors used in EDGAR are mainly based on the EMEP/EEA (2013) guidebook and partly on the latest available scientific knowledge (EMEP/EEA, 2016; see guidebook).
3.D Crop production and agricultural soils
There are four main sources of emissions from crop production and agricultural soils:
- fertiliser application
- crop processes
Tier 1 default approach
Emission
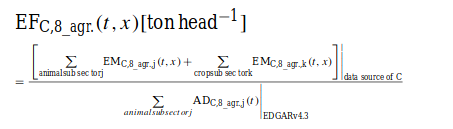
The Tier 1 approach for NH3 emissions from crop production and agricultural soils uses the general equation
E pollutant = AR fertiliser_applied · EF pollutant
where: E pollutant= amount of pollutant emitted (kg a -1 ),
AR fertiliser_applied = amount of N applied (kg a -1 ),
EF pollutant=EF of pollutant (kg kg -1 ).
This equation is applied at the national level, using annual national total fertiliser nitrogen use.
The Tier 1 default NH 3 EF has been derived as a mean of default EFs for individual N fertilisers weighted according to their use as reported by IFA for Europe in 2010.
The Tier 1 emission factors for NH3 = 0.081 kg kg-1 fertilizer-N applied
Activity data
Information is required on the annual consumption national of total N-fertiliser. Annual fertiliser consumption data may be collected from official country statistics, often recorded as fertiliser sales and/or as domestic production and imports. If country-specific data are not available, data from the International Fertiliser Industry Association (www.fertilizer.org/ ) on total fertiliser use by type and by crop, or from the Food and Agriculture Organisation of the United Nations (FAO, http://faostat.fao.org/) on mineral fertiliser consumption, can be used.
Tier 2 technology-specific approach
Emission
Noting the interdependence of direct fertiliser emissions and subsequent emissions from foliage and decomposing residues from fertilised vegetation, the emissions are treated here as a single integrated term. These are estimated as proportional losses of the fertiliser-N use for each of the main fertiliser categories. Emissions from unfertilised crops are considered to be zero.
Tier 2 EFi , kg NH3 kg N-1 Fertiliser type Low soil pH High soil pH
Ammonium nitrate (AN) 0.037 0.037
Anhydrous ammonia 0.011 0.011
Ammonium phosphate (MAP and DAP) 0.113 0.293
Ammonium sulphate (AS) 0.013 0.270
Calcium ammonium nitrate (CAN) 0.022 0.022
Calcium nitrate (CN) 0.009 0.009
Ammonium solutions (AN) 0.037 0.037
Ammonium solutions (Urea AN) 0.125 0.125
Urea ammonium sulphate (UAS) 0.195 0.195
Urea 0.243 0.243
Other NK and NPK 0.037 0.037
Activity data
Information is required on the annual national consumption of the N-fertiliser types shown in Table 3–2. Annual fertiliser consumption data may be collected from official country statistics, often recorded as fertiliser sales and/or as domestic production and imports. If country-specific data are not available, data from the International Fertiliser Industry Association (www.fertilizer.org) on total fertiliser use by type and by crop, or from the Food and Agriculture Organisation of the United Nations (FAO, http://faostat.fao.org/) on mineral fertiliser consumption, can be used. Fertiliser use also needs to be disaggregated by fertiliser type. In addition, if ammonium sulphate or diammonium phosphate are significant sources, then information will be needed on the amounts of those fertilisers applied to soils of < and > pH 7.0
Tier 3 emission modelling and use of facility data
Emission
Tier 3 methodologies are those that result in more accurate estimates of emissions than would be achieved using the Tier 2 methodology. This could include the use of alternative EFs, based on local measurement, the use of more detailed activity data and EFs or the use of process-based models. Users are encouraged to use Tier 3 methodologies wherever possible.
Activity data
Data will typically be required on type of N fertiliser applied, soil pH, land use, application rate, rainfall and temperature. Activity data for model input can be gathered from country-specific databases, trade associations (preferred) or, where these data are unavailable, can be found in different international databases.
Uncertainty
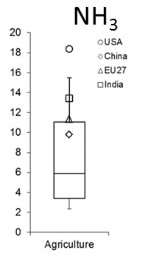
The main uncertainty lies in the generalization of EF, rather than the areas of crops under cultivation which is probably accurate in most countries to better than ± 10 %. The standard deviation in the NH 3 measurements from mineral fertiliser are at the same level as the average measured emission in percent. The overall emissions are probably no better than ± 50 %.
Application of fertiliser-N may be estimated with an accuracy of ± 10 %; other factors such as returns of N in manures may be estimated to within ± 25 %. With respect to national data on crop areas, an uncertainty of < 5 % is assumed, with a normal distribution.
3.B Manure management
There are four main sources of emissions from animal husbandry and manure management:
- livestock feeding
- livestock housing and holding areas
- manure storage
- field-applied manure )
- manure deposited during grazing
Ammonia emissions from livestock production depend on many factors including:
- the amount and N content of feed consumed;
- the efficiency of conversion of N in feed to N in meat, milk and eggs and, hence, the amount of N deposited in excreta;
- the proportion of time spent by animals indoors and outside, e.g. at pasture or on yards or, buildings and on animal behaviour;
- whether livestock excreta are handled as slurry, or solid;
- the housing system of the animal (especially the floor area per animal) and whether manure is stored inside the building;
- climatic conditions in the building (e.g. temperature and humidity) and the ventilation system; the storage system of the manure outside the building: open or covered slurry tank, loose or packed heap of solid manure, any treatment applied to the manure such as aeration, separation or composting..
Ammonia emissions from livestock manures during and after field application depend on:
- properties of the manure, including viscosity, TAN content, C content and pH;
- soil properties such as pH, cation exchange capacity, calcium content, water content, buffer capacity and porosity;
- meteorological conditions including precipitation, solar radiation, temperature, humidity and wind speed;
- the method and rate of application of livestock manures, including, for arable land, the time between application and incorporation, and method of incorporation;
- the height and density of any crop present.
Tier 1 default approach
Emission
The pollutant emissions, E pollutant_animal for each livestock category, using the respective annual average population of each category, AAP animal and the relevant EF pollutant_animal : E pollutant_animal = AAP animal · EF pollutant_animal
where AAP animal=number of animals of a particular category that are present, on average, within the year. For a fuller explanation, see IPCC (2006).
Default Tier 1 EF (EF NH3 ) for calculation of NH 3 emissions from manure management.
Dairy cows slurry 39.3
Dairy cows solid 28.7
Other cattle (including young cattle, beef cattle and slurry suckling cows) 13.4
Other cattle solid 9.2
Fattening pigs slurry 6.7
Fattening pigs solid 6.5
Sows slurry 15.8
Sows solid 18.2
Sows outdoor 7.3
Sheep (and goats) solid 1.4
Horses (and mules, asses) solid 14.8
Laying hens (laying hens and parents) solid 0.48
Laying hens (laying hens and parents) slurry 0.48
Broilers (broilers and parents) litter 0.22
Other poultry (ducks) litter 0.68
Other poultry (geese) litter 0.35
Other poultry (turkeys) litter 0.95
Fur animals 0.02
Camels solid 10.5
Buffalo solid 9.0
Activity data
For Tier 1, data are required on animal numbers for each of the categories listed in the Table. An annual national agricultural census can supply these data. Otherwise, statistical information from Eurostat (http://epp.eurostat.ec.europa.eu) or the Food and Agriculture Organization of the United Nations (FAO) Production Yearbook (FAO, 2005/2006) can be used.
Tier 2 technology-specific approach
Emission
Tier 2 uses a mass flow approach based on the concept of a flow of TAN (total ammoniacal-N) through the manure management system.It should be noted that the calculations of a mass flow approach must be carried out on the basis of kg N. The resultant estimates of NH 3 -N emissions are then converted to NH 3 . When calculating emissions of NH 3 using a mass flow approach, a system based on TAN is preferred to one based on total N.
Activity data
should be gathered from national farming statistics and farm practice surveys; of particular importance are estimates of the length of the grazing period for ruminants, how long manure is stored and the type of store and manure treatment used, and the method of manure application to land. For manures applied to tillage land, the interval before incorporation is also needed.
Tier 3 emission modelling and use of facility data
Emission
There is no restriction on the form of Tier 3, provided it can supply estimates that can be demonstrated to be more accurate than Tier 2. If data are available, emission calculations may be made for a greater number of livestock categories than listed under Tier 2.
Uncertainty
Uncertainties in NH 3 EFs vary considerably. A recent UK study indicated a range from ± 14 % for the EF for slurry spreading to ± 136 % for beef cattle grazing. In general, EFs for the larger sources tended to be based on a greater number of measurements than those for smaller sources and, in consequence, tended to be more certain. The exceptions were the EFs for buildings in which livestock were housed on straw and grazing EFs for beef and sheep. The uncertainties of partial EFs have yet to be discussed. The overall uncertainty for the UK ammonia emissions inventory, as calculated using a Tier 3 approach, was ± 21 % (Webb and Misselbrook, 2004), while that for the Netherlands, also using a Tier 3 approach, was ± 17 % (Van Gijlswijk et al., 2004). There is likely to be greater uncertainty in estimates of activity data, although for such data, a quantitative assessment of uncertainty is difficult to determine. Webb and Misselbrook (2004) reported that eight of the ten input data to which estimates of UK NH 3 emissions were the most sensitive were activity data.
Attachments (4)
- EM.png (8.4 KB) - added by msaad 6 years ago.
- EM1.png (13.7 KB) - added by msaad 6 years ago.
- EM2.png (8.6 KB) - added by msaad 6 years ago.
- EM3.png (5.3 KB) - added by msaad 6 years ago.
Download all attachments as: .zip