User guide for cpu-Monitoring Tool and Data Management Tools
This page is still in construction.
Update: November 2020 - Eliott Dupont
Table of contents
1. cpu Consumption Monitoring
The cpu Consumption Monitoring is available for each each computing project either at IDRIS or TGCC on this page.
The data used for the graphs is extracted from logs of ccc_myproject at TGCC and logs of idracct at IDRIS.
The graphs are updated daily, at 8 a.m. for TGCC and at 9 a.m. for IDRIS.
How to make sure the graph is up to date ? To check if the graph is up to date, youo should check the title of the first graph. It displays the date of the last measurment of cpu hours. Therefor if today is the 15th of April the graph is up to date is the title says '2020-04-14'.
If a project has hours allocated to multiple types of processors on the same machine (ex: skylake and knl on IRENE) there will be one line plot and one bar plot per type of processor.
Example for project gen7632 :
1.1. Hover Tool
The hover tool can be disable/enabled by clicking on this icon.
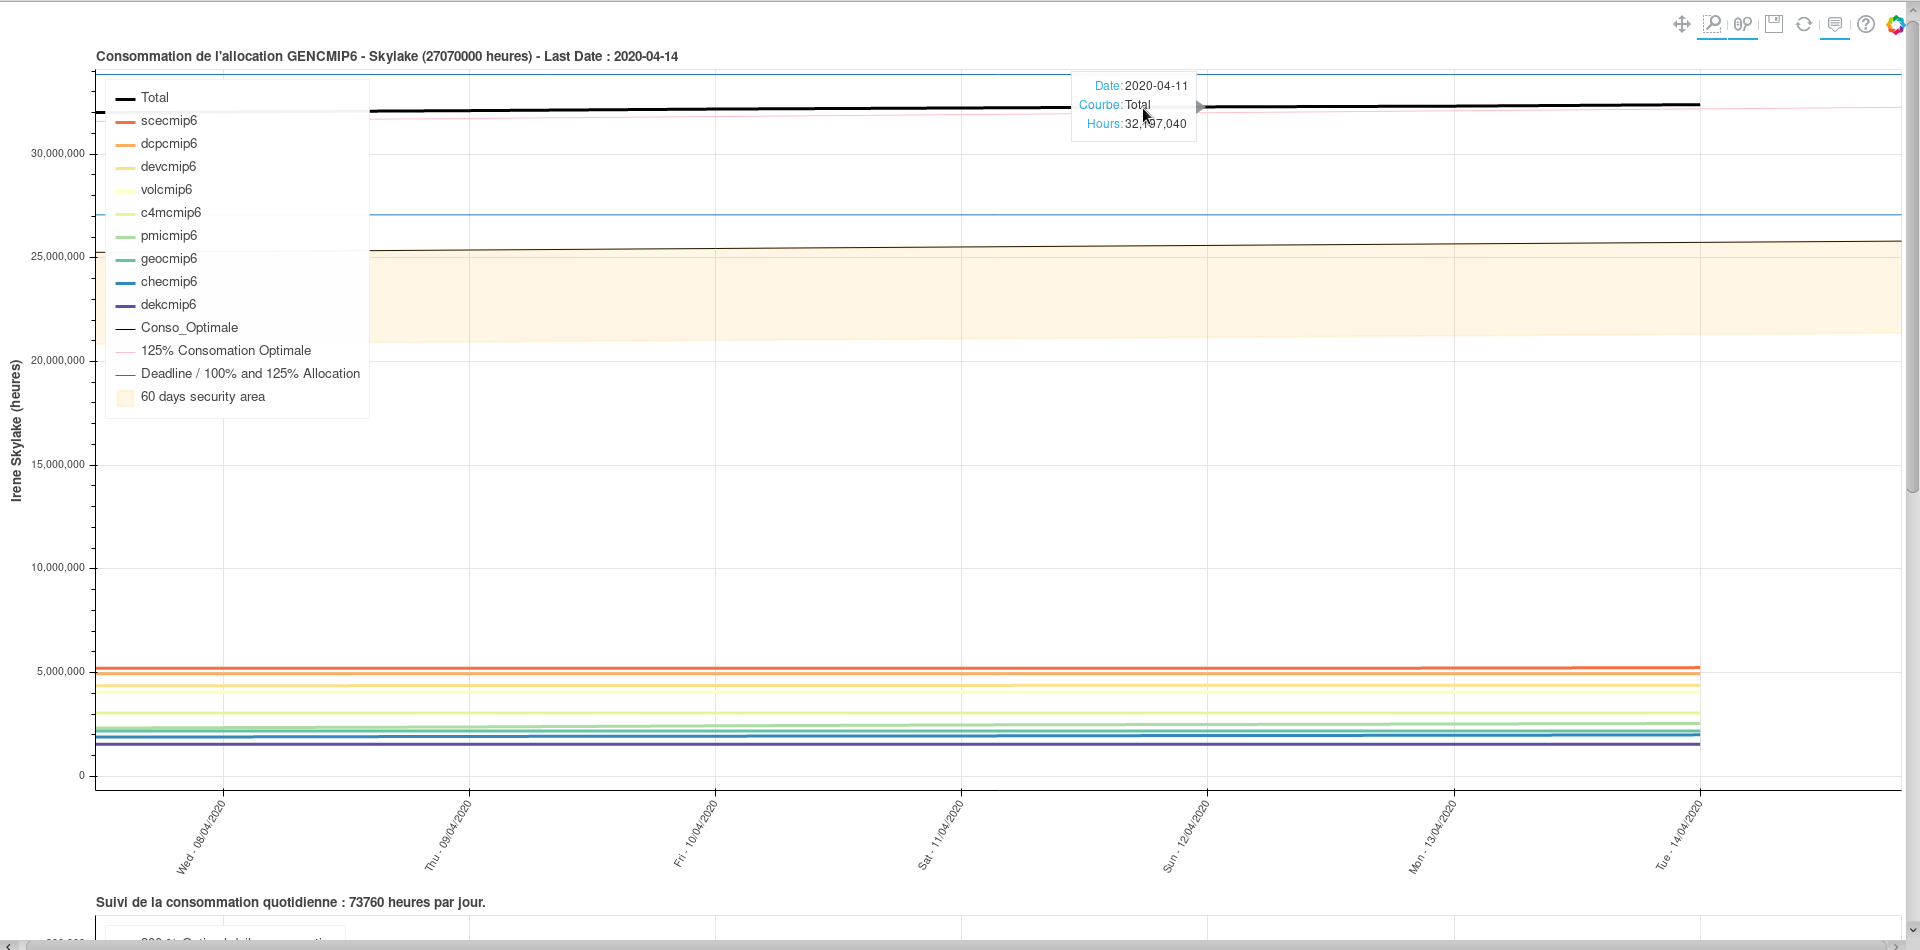
When enable it will allow the display of information about curves when hovering over them on the graphs. Here is what you can learn :
- How many hours the project is in advance/late regarding the optimal consumption curve;
- A better estimate of the value/date of a given point of a curve.
 Example of hovering over 'Total' curve on top plot.
- The name of the curve (usefull when multiple subproject displayed on the same graph, ex: gencmip6)
- For the daily consumption plot, how many hours the project consummed for a given day and how the difference with optimal consumption.
 Example of hovering to the daily delay/advance on the bottom plot.
1.2. Zooming in and out
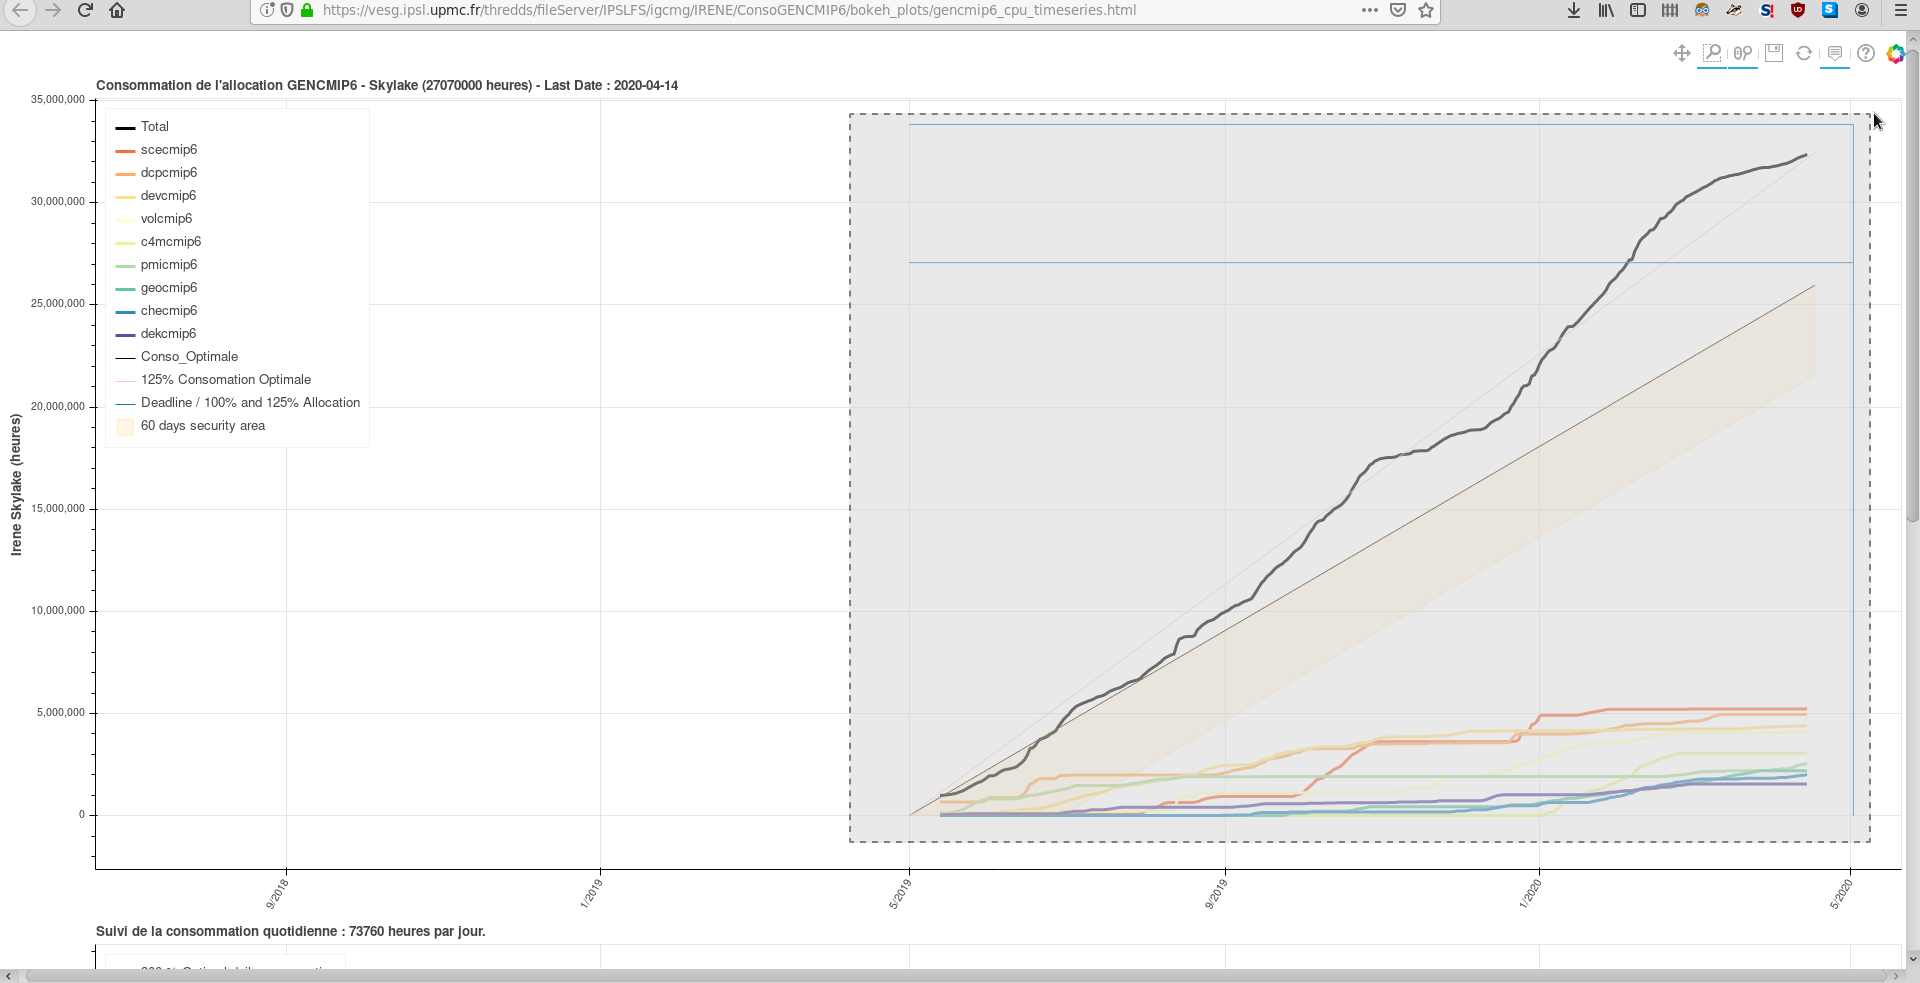
You can use the box zoom option to zomm on a selected area.
The x-axis (time) of the two plots are linked for better visibility.
To zoom out it is easier to use the wheel zoom. It will act differently depending if your mouse pointer is on the graph (the zoom will x-and-y and centered on it) or on an axis (the zoom will be only x XOR Y and centered on your mouse pointer).
Zooming out will allow you to see the blue lines corresponding to the date of the end of the allocation (vertical line on the right hand side) and to the lines corresponding to 100% and 125% of the project allocation. 125% is the theorical maximum of hours one project can consume.
Example of box zoom after zomming out with the wheel zoom. The full timeseries is visible.
1.3. Reset Tool
If you want to go back to the original display of the graph, you can click on the reset button.

1.4. Security area
Bellow the optimal consumption curve is the security area. It represent the area your project consumption should dstay in in order to avoid lateness penalty.
At TGCC, you will get 1 mounth penalty if the project is more than 2 mounths late on the 15th of a given month.
At IDRIS, (about the same, complete)
2. Data Management Tools
Documentation is here
2.1. Monitoring
So far, the STORE/WORK/SCRATCH per-project usage monitoring is available on demand. It provides daily update curves displaying the aggregated volume of data and total number of inodes for a given project as a timeseries. Curves will be available at https://thredds-su.ipsl.fr/thredds/fileServer/igcmg/SUIVI_CONSO/VISUALISATION/index.html on the link "Stockage [...] TIMESERIES"
The left column represent the volume of data used by the project for STORE/WORK/SCRATCH. The right column represent the number of inodes of sata used by the project for STORE/WORK/SCRATCH.
The data used to plot these graph is extracted from logs of the output of the command ccc_quota -d (details) on IRENE, for each project monitored. Therefore the data displayed does not take into account inodes and volumes of data stored on on THREDDS.
The quota of inodes and volume is visible by zomming out on the different graphs (horizontal red line).
2.2. Inodes / Data Diagnostic
The Inodes / Data Diagnostic tool consists in a application to help the user assess which of their directories have the most data or takes the most inodes. Thanks to the tool, the user can more easily select what experiments they want to delete and download a path list to delete manually on the computing center. There are different step at using this tool :
- Data Acquisition from IRENE
- Parsing the raw data logs
- Visualising the parsed log on https://outils.ipsl.fr/conso-calcul/app
2.2.1. Step 1 : Data Acquisition from IRENE
The first step for using the app is to log the output from the ccc_tree command at TGCC.
2.2.1.1. Is it your first time doing this ?
For the acquisition process you will run a bash script. There are a few things you need to prepare beforehand.
You will need to :
- know the path of the directory you want to inspect. Write it down on a side document.
- create directory called raw_logs on one of your WORKDIRs.
Create it using mkdir and write the full path down on a side document. (Example : $GENCMIP6_CCCWORKDIR/raw_logs)
- Choose a descriptive name for your output file.
For example if you are inspecting your workdir for project genxxx, you can use : WORK_genxxx_<login>. Write it down on a side document. The _<date>.txt will be added automatically.
You will be able to use this raw_logs directory for your future data acquisitions.
2.2.1.2. Acquiring Data :
You are now ready to start the acquisition process.
The script running 'ccc_tree' with the proper inputs is 'script_v2_manual.sh'. It can take a while to execute therefore it should be launched from IRENE computer in a screen session.
- screen -S ccc_tree_session
- module switch dfldatadir/gencmip6
- bash $GENCMIP6_CCCHOME/../dupontel/tests_DMP/script_v2_manual.sh
The script asks you for the information you wrote down on the previous step (path of the directory to inspect, path of the raw_logs directory in the WORK space where you want to write the data and output file name, without the date).
- Ctrl + a -- d to detach the screen session.
The screen session is used to be able to logout from TGCC if the process is taking to long.
- Check if the thredds_cp command was ran correctly : your output file should use two inodes and exists on your thredds/work directory.
ls -l $GENCMIP6_CCCWORKDIR/raw_logs/<filename> output :
-rw-r--r-- 2 <user> <group> <size> <date> <filename>
Instead of :
-rw-r--r-- 1 <user> <group> <size> <date> <filename>
If this is not the case, you should re-run the last 'thredds_cp' command of the 'script_v2_manual.sh' script. thredds cp <path-to-file> <path-to-thredds>/${LOGNAME}/raw_logs/
2.2.2. Step 2 : Parse the raw log to get yaml file.
2.2.2.1. Install the conda environment
To parse the raw logs, you first need to install the appropriate conda environment : PARSER_env.
So far you will have to install it locally on your ciclad account. Later, we plan on having on shared conda env that any user will be able to load.
To install the conda environment, run the following commands :
PARSER_DIR="/projsu/igcmg/DMP_TOOLS/dmp_tools"
module load python/3.6-anaconda50
conda env create -f $PARSER_DIR/environment.yml --name PARSER_env
source activate PARSER_env
pip install anytree
2.2.2.2. Running the parser
First get the name of the file you want to parse. You can refer to the Step 1 to get get the raw_log filename.
Then you must run :
/projsu/igcmg/DMP_TOOLS/run_parser.sh <input_filename.txt>
With <input_filename.txt> the name of the file produced in Step 1.
If everything went correctly, the output file will be written in $PARSER_DIR/../parsed_logs
The output parsed log must be moved to /projsu/igcmg/DMP_TOOLS/parsed_logs. Keep its name written elsewhere. It will be usefull for visualisation.
If any error were met, first, check you input file. If the error continues you can send an email get some help / report a bug.
2.2.3. Step 3 : Visualising the parsed logs
Go to https://outils.ipsl.fr/conso-calcul/app
To connect to the app, you need you ipsl federation credential. It looks like that : login[@]ipsl.fr or login[@]labo.ipsl.fr.
Do not mistake it with : prenom.nom[@]ipsl.fr or prenom.nom[@]labo.ipsl.fr
Note the name of the parsed log you obtained and copied to /projsu/igcmg/DMP_TOOLS/parsed_logs
You can also do ls /projsu/igcmg/DMP_TOOLS/parsed_logs to see the list of files available for visualisation.
Write that name in the text field : 'Input File Name' on the app page.
Click on the 'Change Input File' button. If the file is different, the new data should be loading.
Warning : depending on the file size, it may take a few moment to load the data to visualize. If you wait more than one minute, try to check the name you provided. Clicking on the 'Change Input File' button will restart the loading, thus take longer.
Attachments (9)
- zoom_select.png (129.6 KB) - added by edupont 5 years ago.
- reset.png (709 bytes) - added by edupont 5 years ago.
- quotas_monitoring_gencmip6.png (73.9 KB) - added by edupont 5 years ago.
- hover_bar0.png (49.9 KB) - added by edupont 5 years ago.
- hover0.png (77.2 KB) - added by edupont 5 years ago.
- gen7632.png (127.6 KB) - added by edupont 5 years ago.
- hover_name.png (187.4 KB) - added by edupont 5 years ago.
- hover_avance.png (113.5 KB) - added by edupont 5 years ago.
- title.png (5.4 KB) - added by edupont 5 years ago.
Download all attachments as: .zip


