| Version 2 (modified by edupont, 4 years ago) (diff) |
|---|
User guide for cpu-Monitoring Tool and Data Management Tools
This page is still in construction.
Table of contents
1. cpu Consumption Monitoring
The cpu Consumption Monitoring is available for each each computing project either at IDRIS or TGCC on this page.
The data used for the graphs is extracted from logs of ccc_myproject at TGCC and logs of idracct at IDRIS.
The graphs are updated daily, at 8 a.m. for TGCC and at 9 a.m. for IDRIS.
How to make sure the graph is up to date ? To check if the graph is up to date, youo should check the title of the first graph. It displays the date of the last measurment of cpu hours. Therefor if today is the 16th of April the graph is up to date is the title says '2020-04-15'.
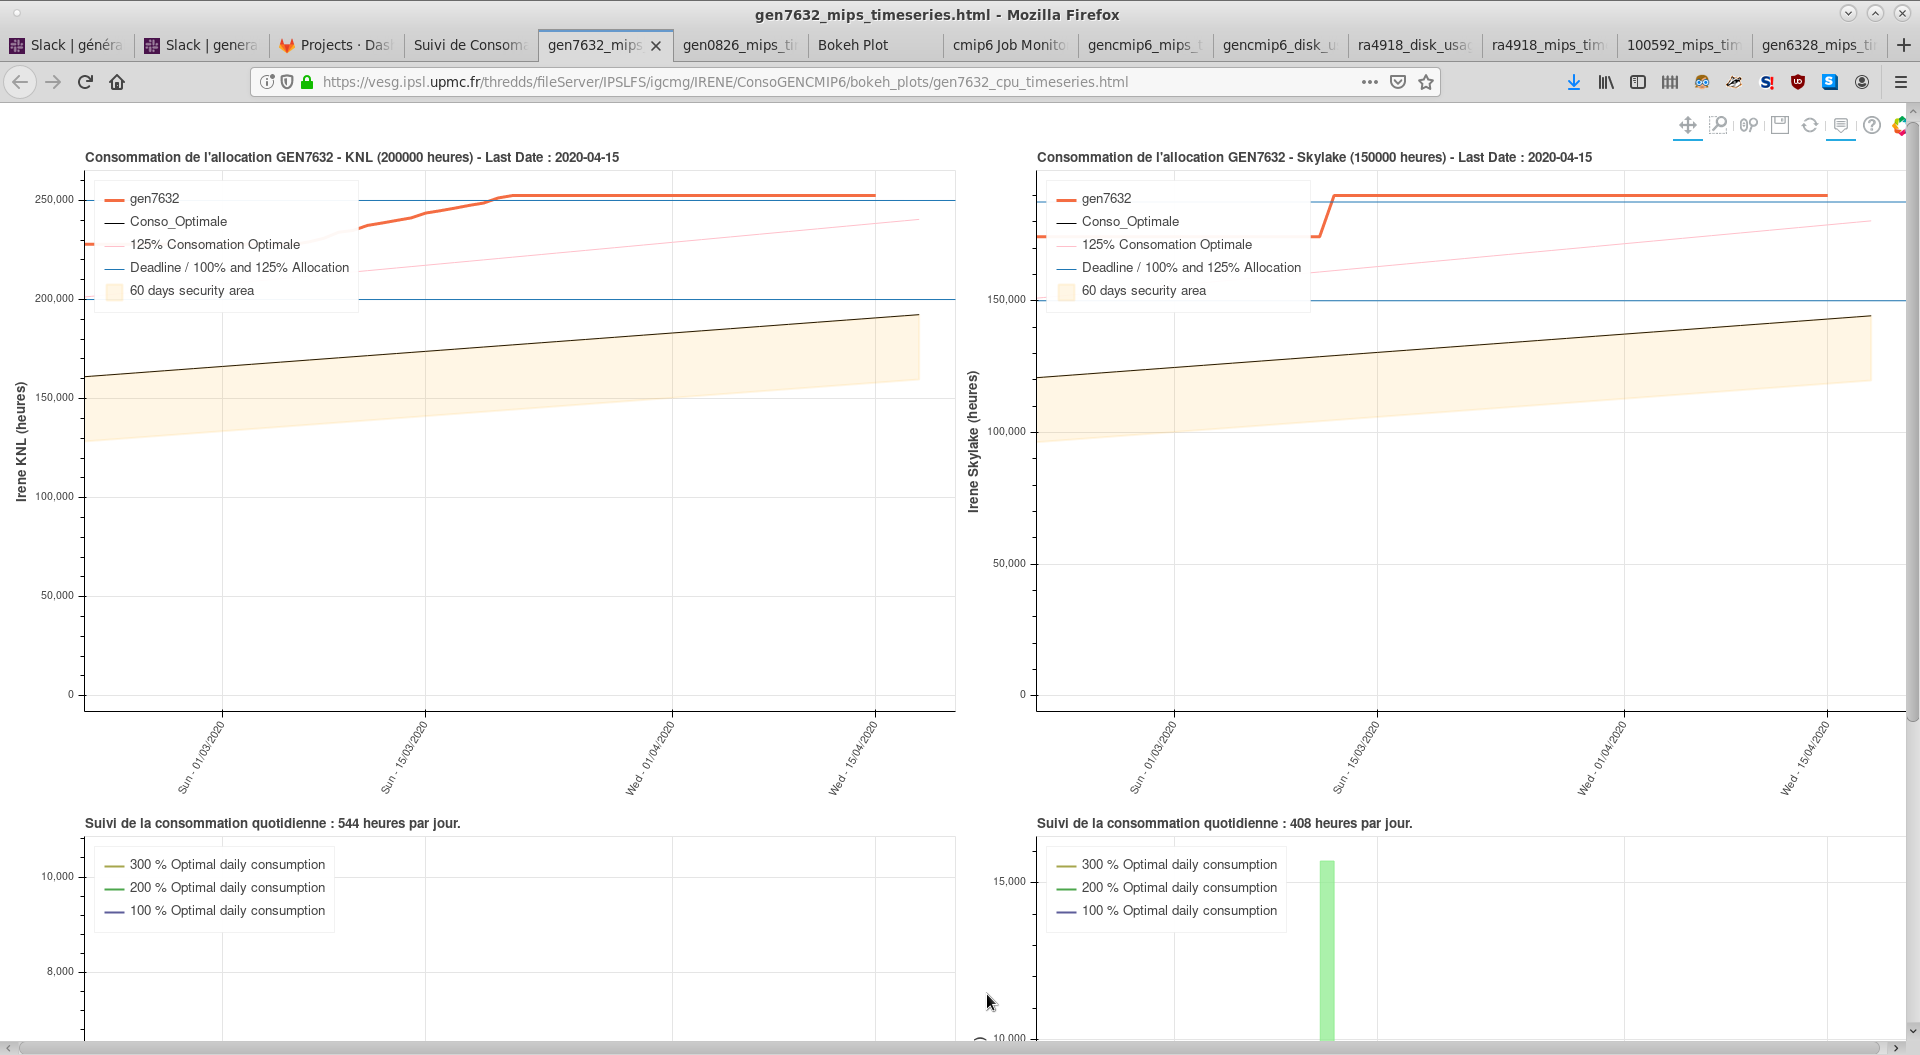
If a project has hours allocated multiple tipes of processors on the same machine (ex: skylake and knl on IRENE) there will be one line plot and one bar plot per type of processor.
Example for project
1.1. Hover Tool
The hover tool can be disable/enabled by clicking on this icon.
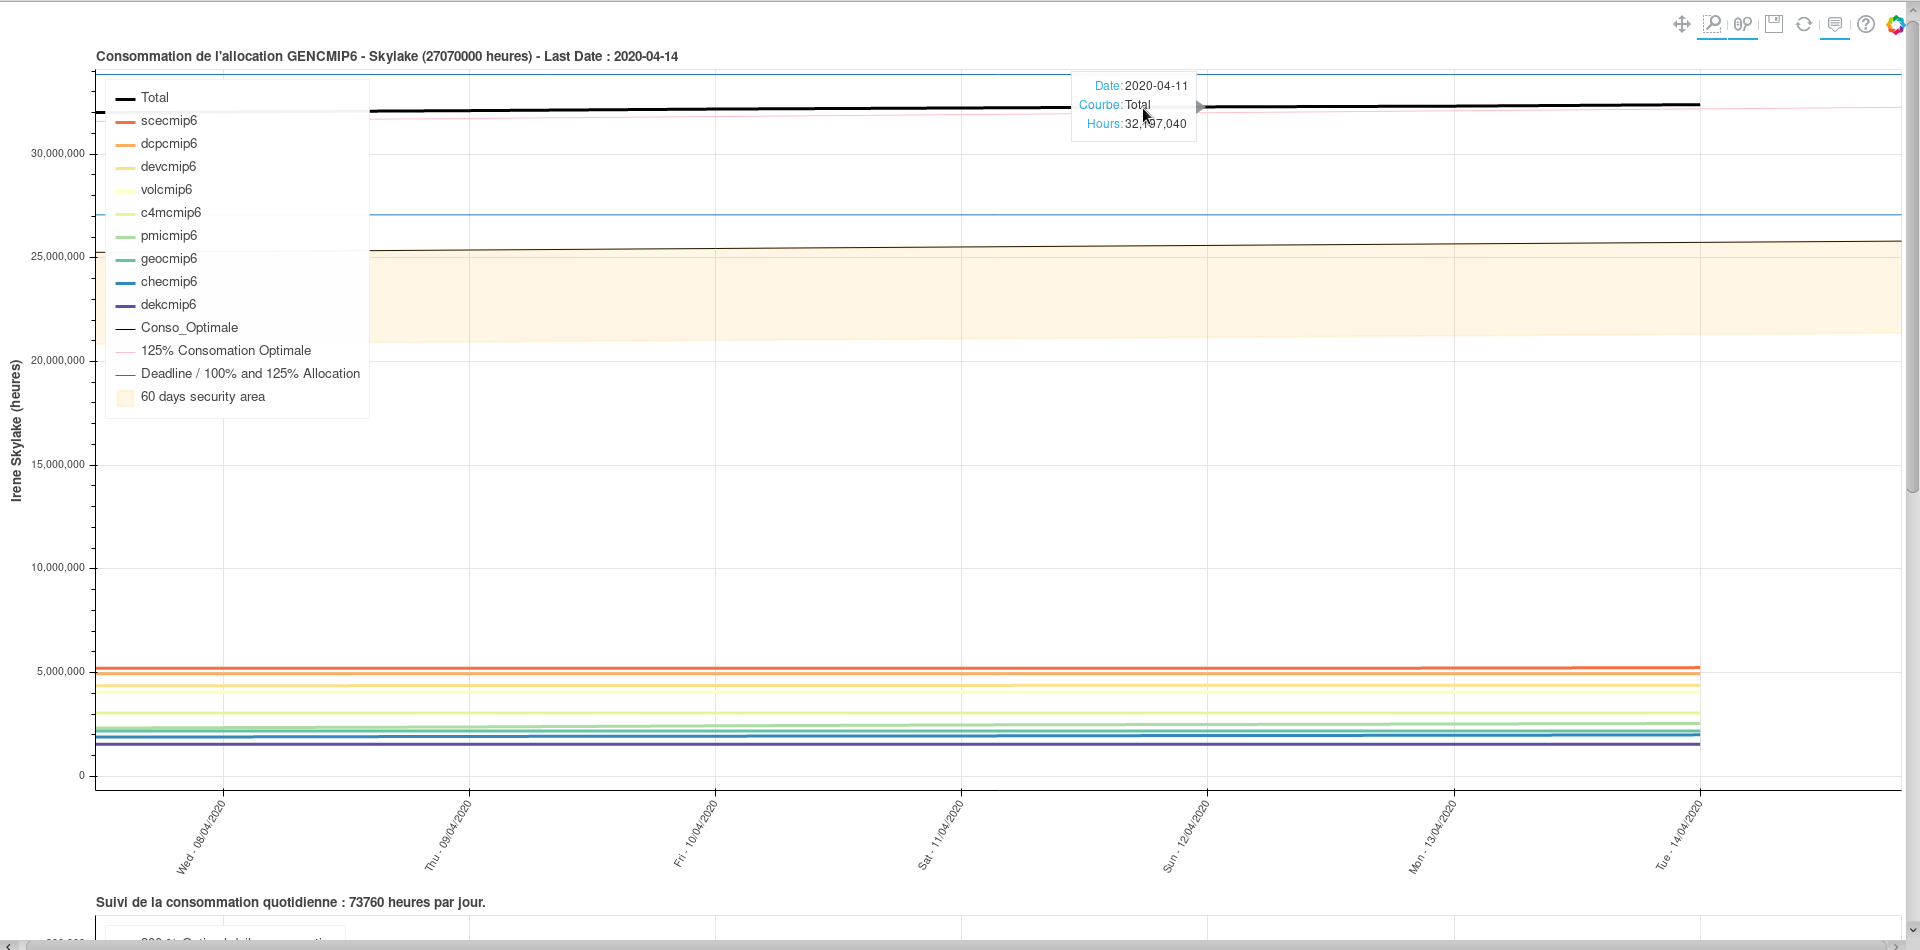
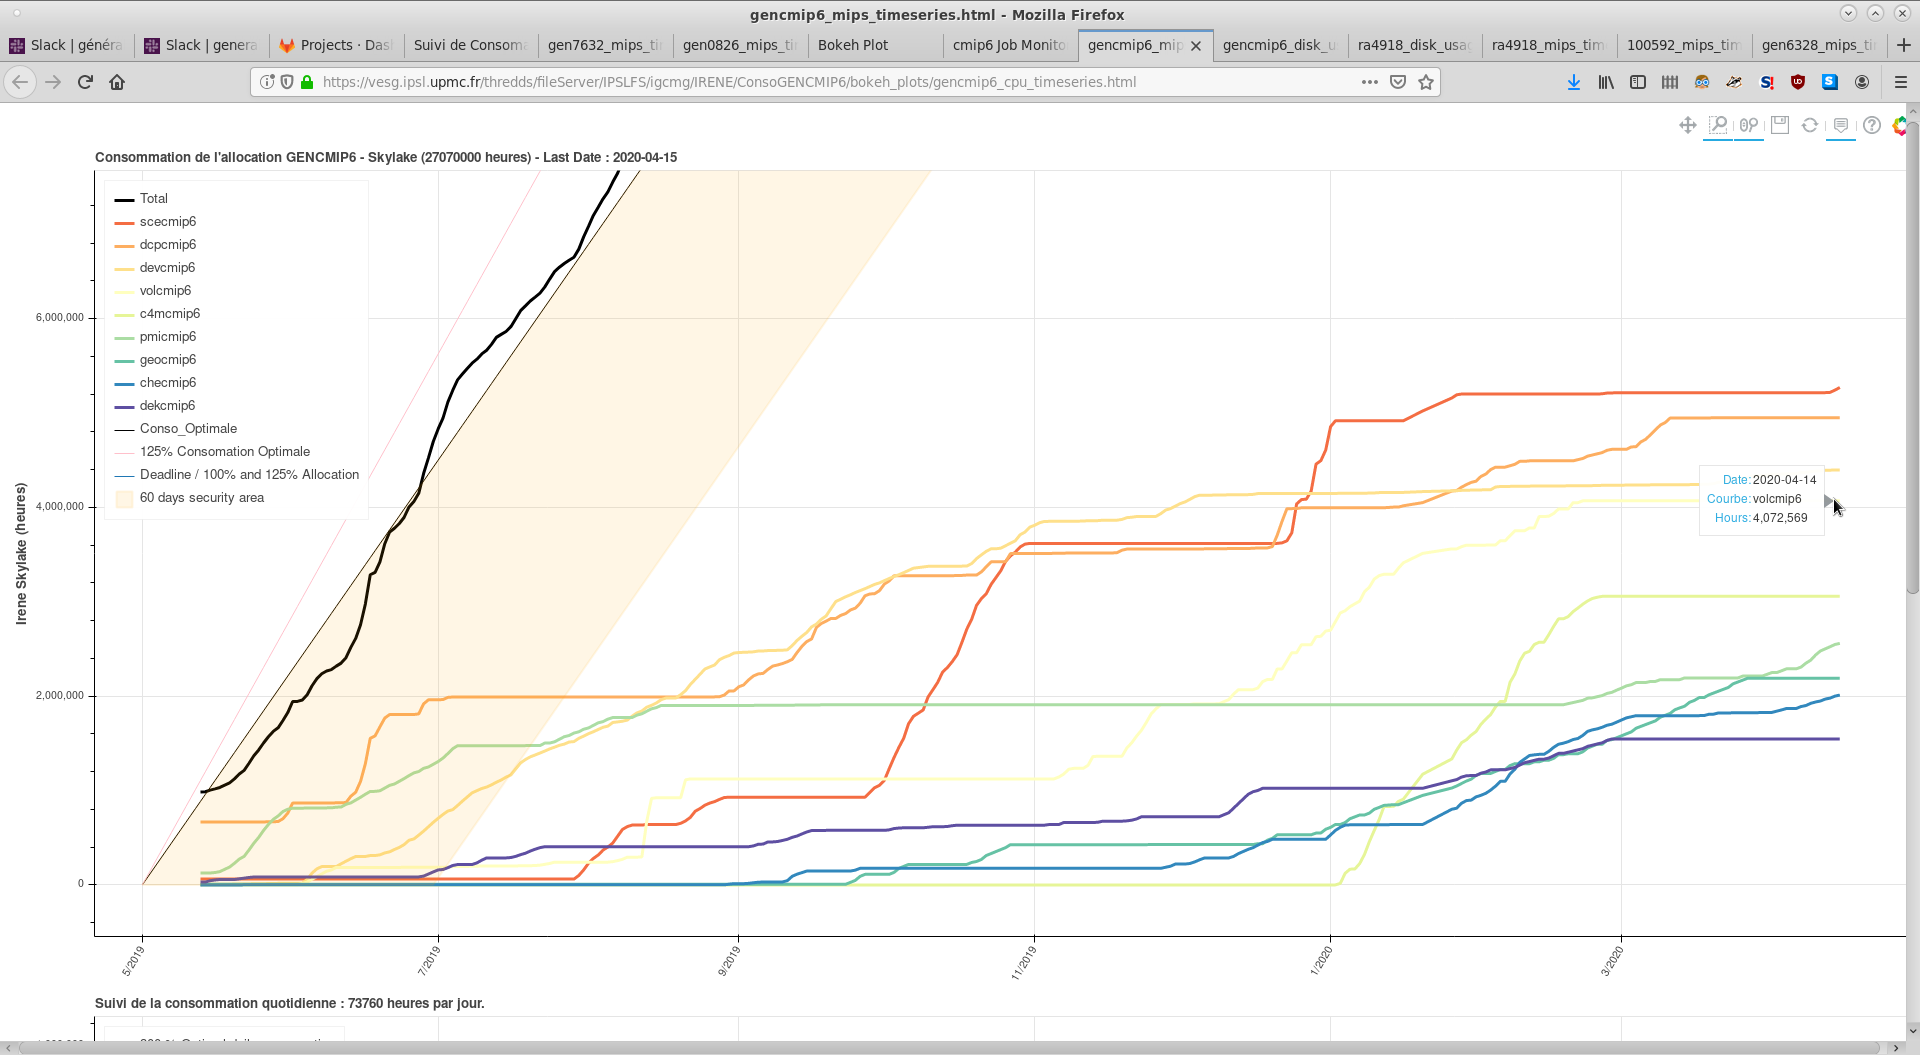
When enable it will allow the display of information about curves when hovering over them on the graphs. Here is what you can learn :
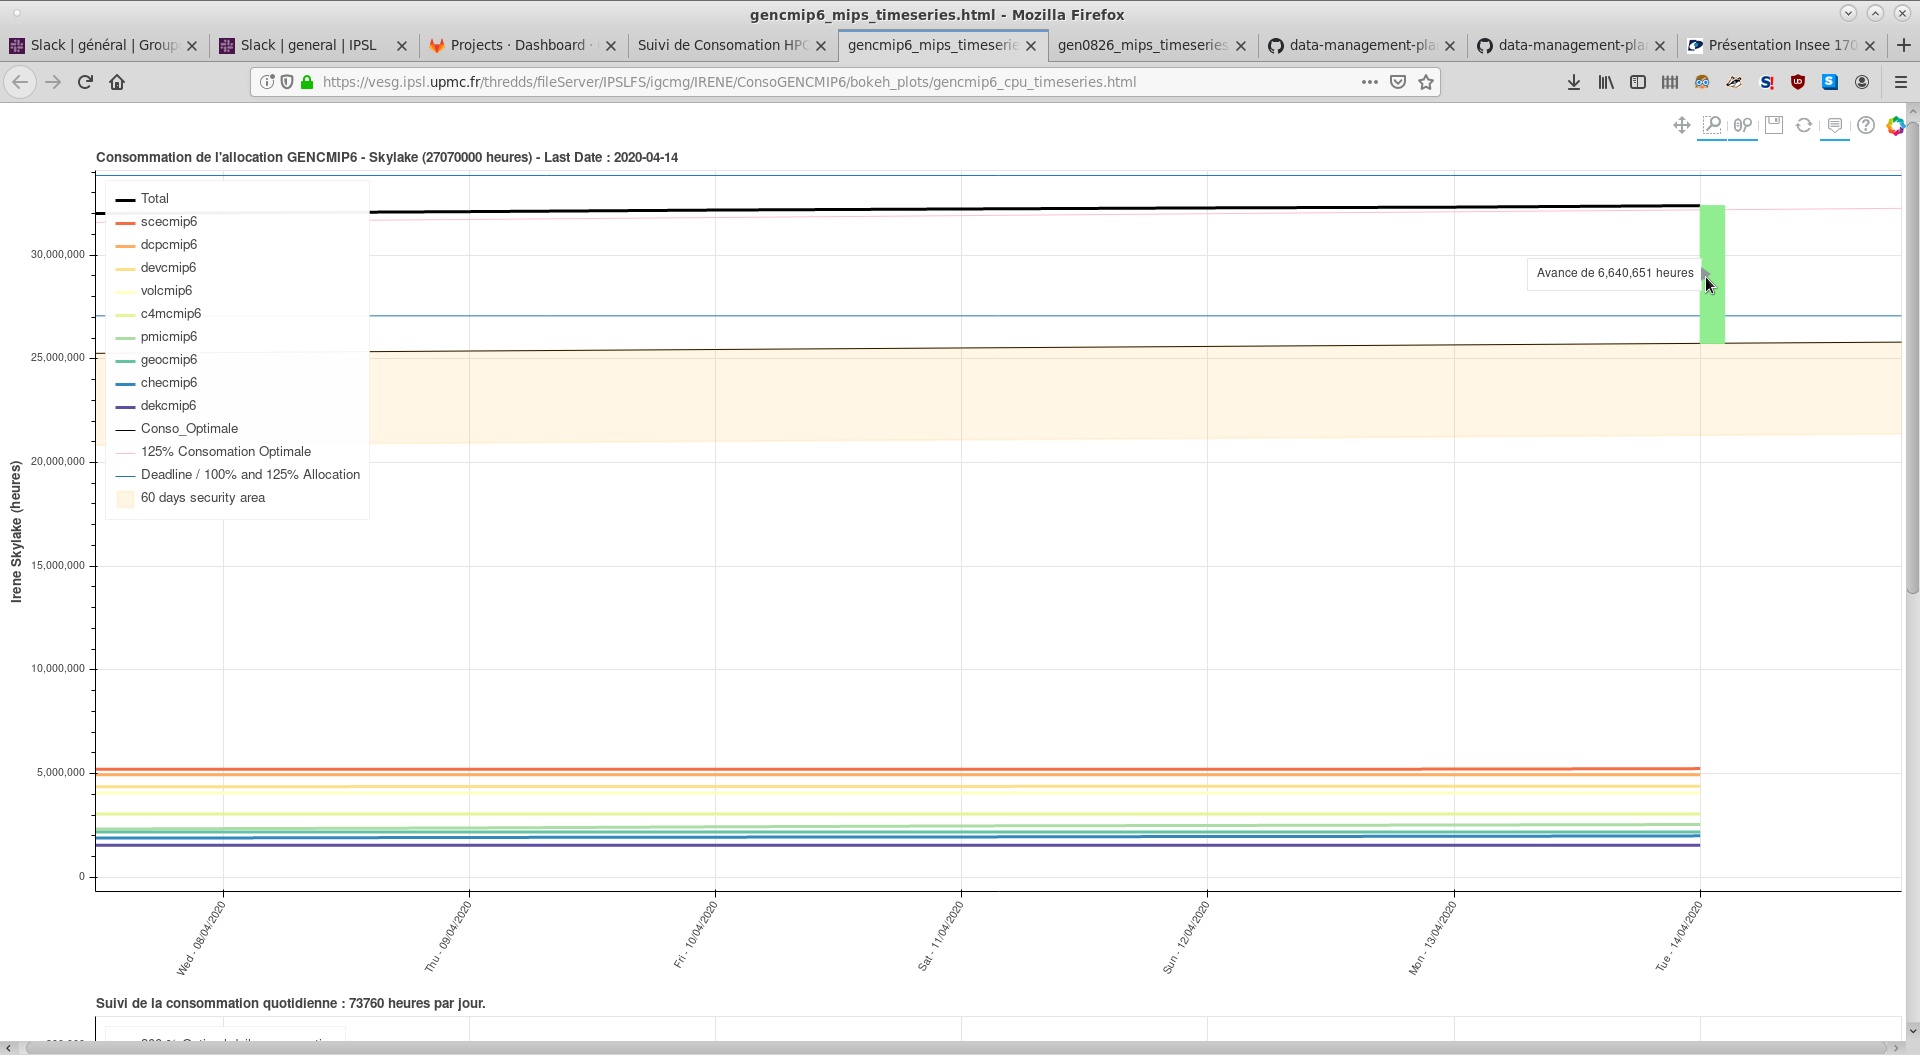
- How many hours the project is in advance/late regarding the optimal consumption curve;
- A better estimate of the value/date of a given point of a curve.
- The name of the curve (usefull when multiple subproject displayed on the same graph, ex: gencmip6)
- For the daily consumption plot, how many hours the project consummed for a given day and how the difference with optimal consumption.
 Example of hovering over 'Total' curve on top plot.
 Example of hovering to the daily delay/advance on the bottom plot.
1.2. Zooming in and out
You can use the box zoom option to zomm on a selected area.
The x-axis (time) of the two plots are linked for better visibility.
To zoom out it is easier to use the wheel zoom. It will act differently depending if your mouse pointer is on the graph (the zoom will x-and-y and centered on it) or on an axis (the zoom will be only x XOR Y and centered on your mouse pointer).
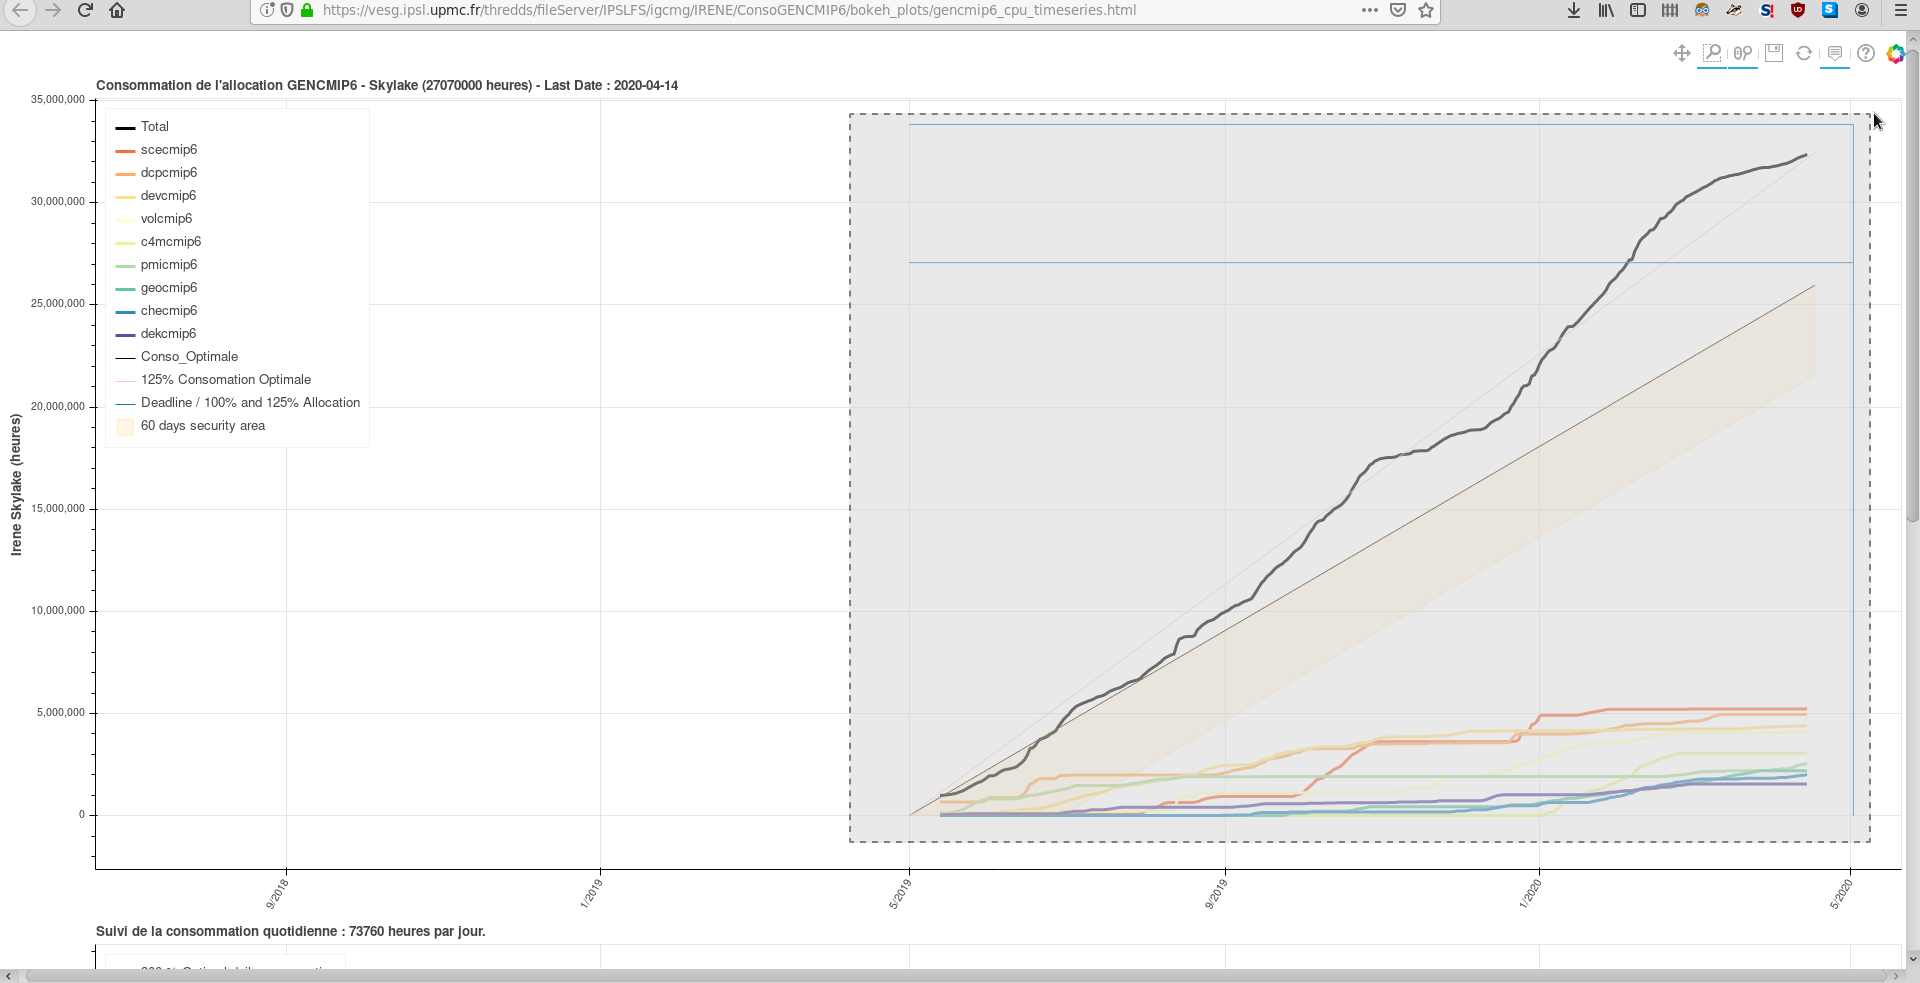
Zooming out will allow you to see the blue lines corresponding to the date of the end of the allocation (vertical line on the right hand side) and to the lines corresponding to 100% and 125% of the project allocation. 125% is the theorical maximum of hours one project can consume.
 Example of box zoom after zomming out with the wheel zoom. The full timeseries is visible.
1.3. Reset Tool
If you want to go back to the original display of the graph, you can click on the reset button. [[Image(reset.png)]25px]
1.4. Security area
Bellow the optimal consumption curve is the security area. It represent the area your project consumption should dstay in in order to avoid lateness penalty.
At TGCC, you will get 1 mounth penalty if the project is more than 2 mounths late on the 15th of a given month.
At IDRIS, (about the same, complete)
2. Data Management Tools
Documentation is here
Monitoring :
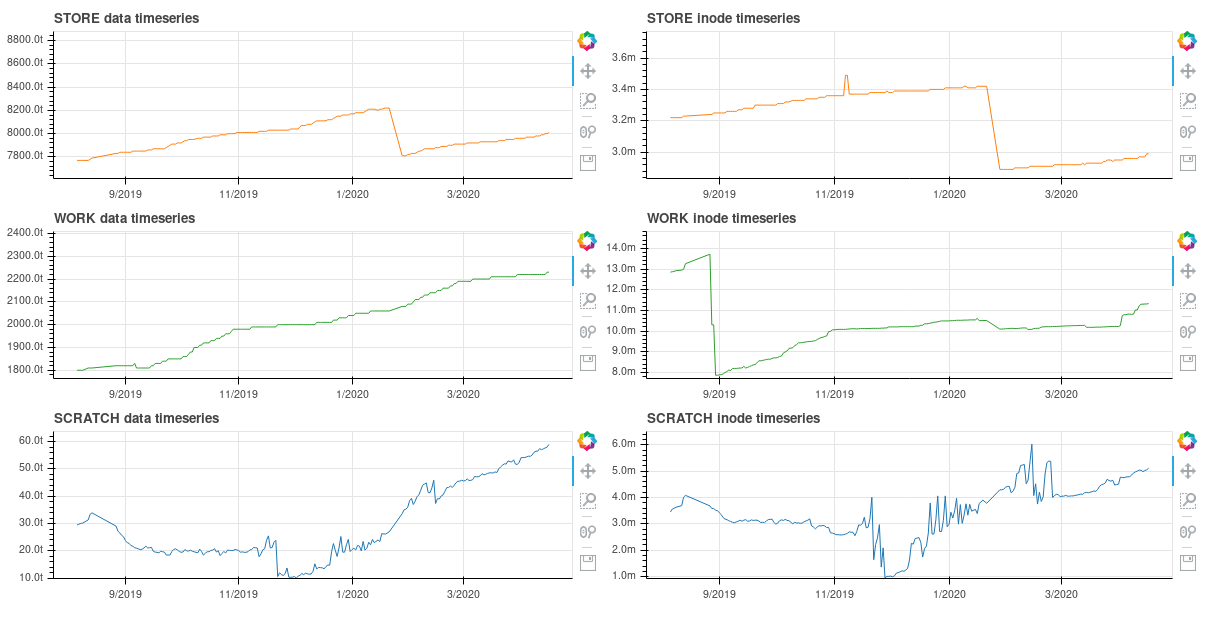
So far, the STORE/WORK/SCRATCH per-project usage monitoring is available on demand. It provides daily update curves displaying the aggregated volume of data and total number of inodes for a given project as a timeseries. Curves will be available at https://vesg.ipsl.upmc.fr/thredds/fileServer/IPSLFS/igcmg/IRENE/ConsoGENCMIP6/index.html on the link "Stockage [...] TIMESERIES"
The left column represent the volume of data used by the project for STORE/WORK/SCRATCH. The right column represent the number of inodes of sata used by the project for STORE/WORK/SCRATCH.
The data used to plot these graph is extracted from logs of the output of the command ccc_quota -d (details) on IRENE, for each project monitored. Therefore the data displayed does not take into account inodes and volumes of data stored on on THREDDS.
The quota of inodes and volume is visible by zomming out on the different graphs (horizontal red line).
[[Image(quotas_monitoring_gencmip6.png)]600px]
Cleaning :
The cleaning tool consists in a diagnostic application to help the user assess which of their directories have the most data or takes the most inodes. Thanks to the tool, the user can more easily select what experiments they want to delete and download a path list to delete manually on the computing center. The tool is still under development. A beta version is available on demand. Ask edupont at ipsl.fr for it.
Attachments (9)
- zoom_select.png (129.6 KB) - added by edupont 4 years ago.
- reset.png (709 bytes) - added by edupont 4 years ago.
- quotas_monitoring_gencmip6.png (73.9 KB) - added by edupont 4 years ago.
- hover_bar0.png (49.9 KB) - added by edupont 4 years ago.
- hover0.png (77.2 KB) - added by edupont 4 years ago.
- gen7632.png (127.6 KB) - added by edupont 4 years ago.
- hover_name.png (187.4 KB) - added by edupont 4 years ago.
- hover_avance.png (113.5 KB) - added by edupont 4 years ago.
- title.png (5.4 KB) - added by edupont 4 years ago.
Download all attachments as: .zip
