| Version 1 (modified by edupont, 4 years ago) (diff) |
|---|
User guide for cpu-Monitoring Tool and Data Management Tools
This page is still in construction.
Table of contents
1. cpu Consumption Monitoring
Documentation is here
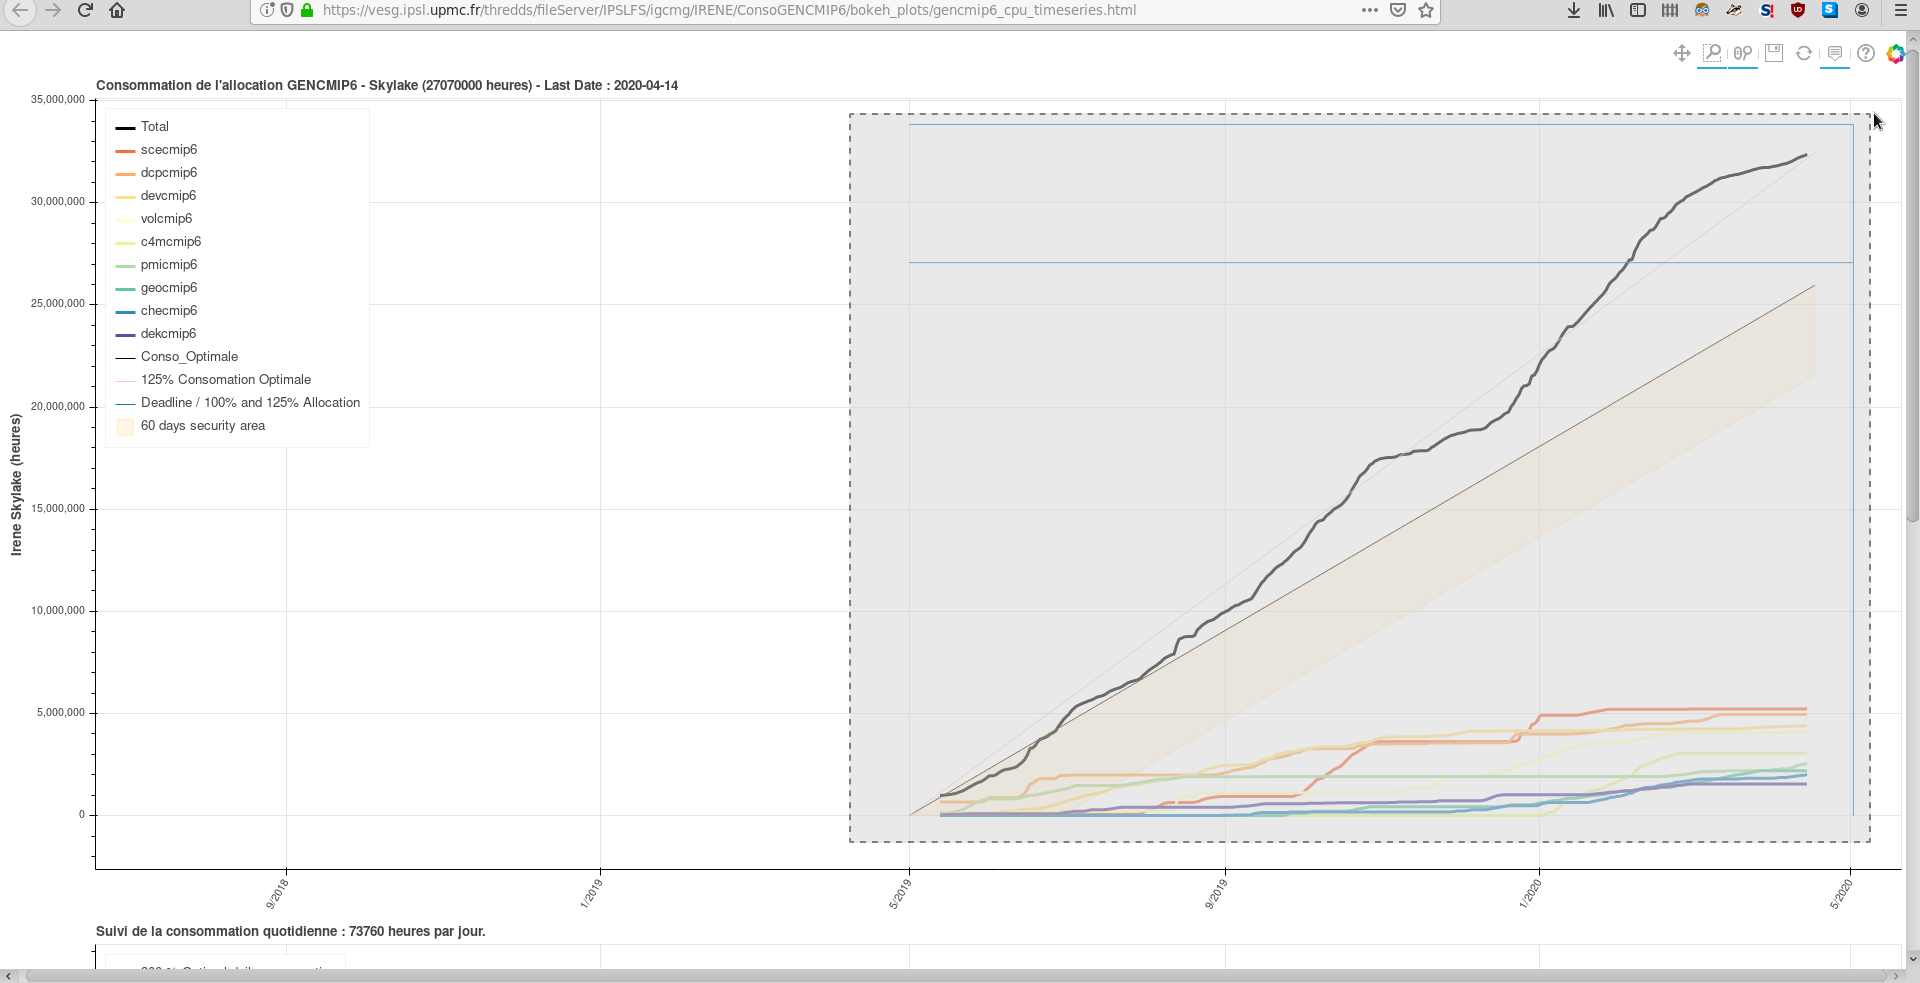
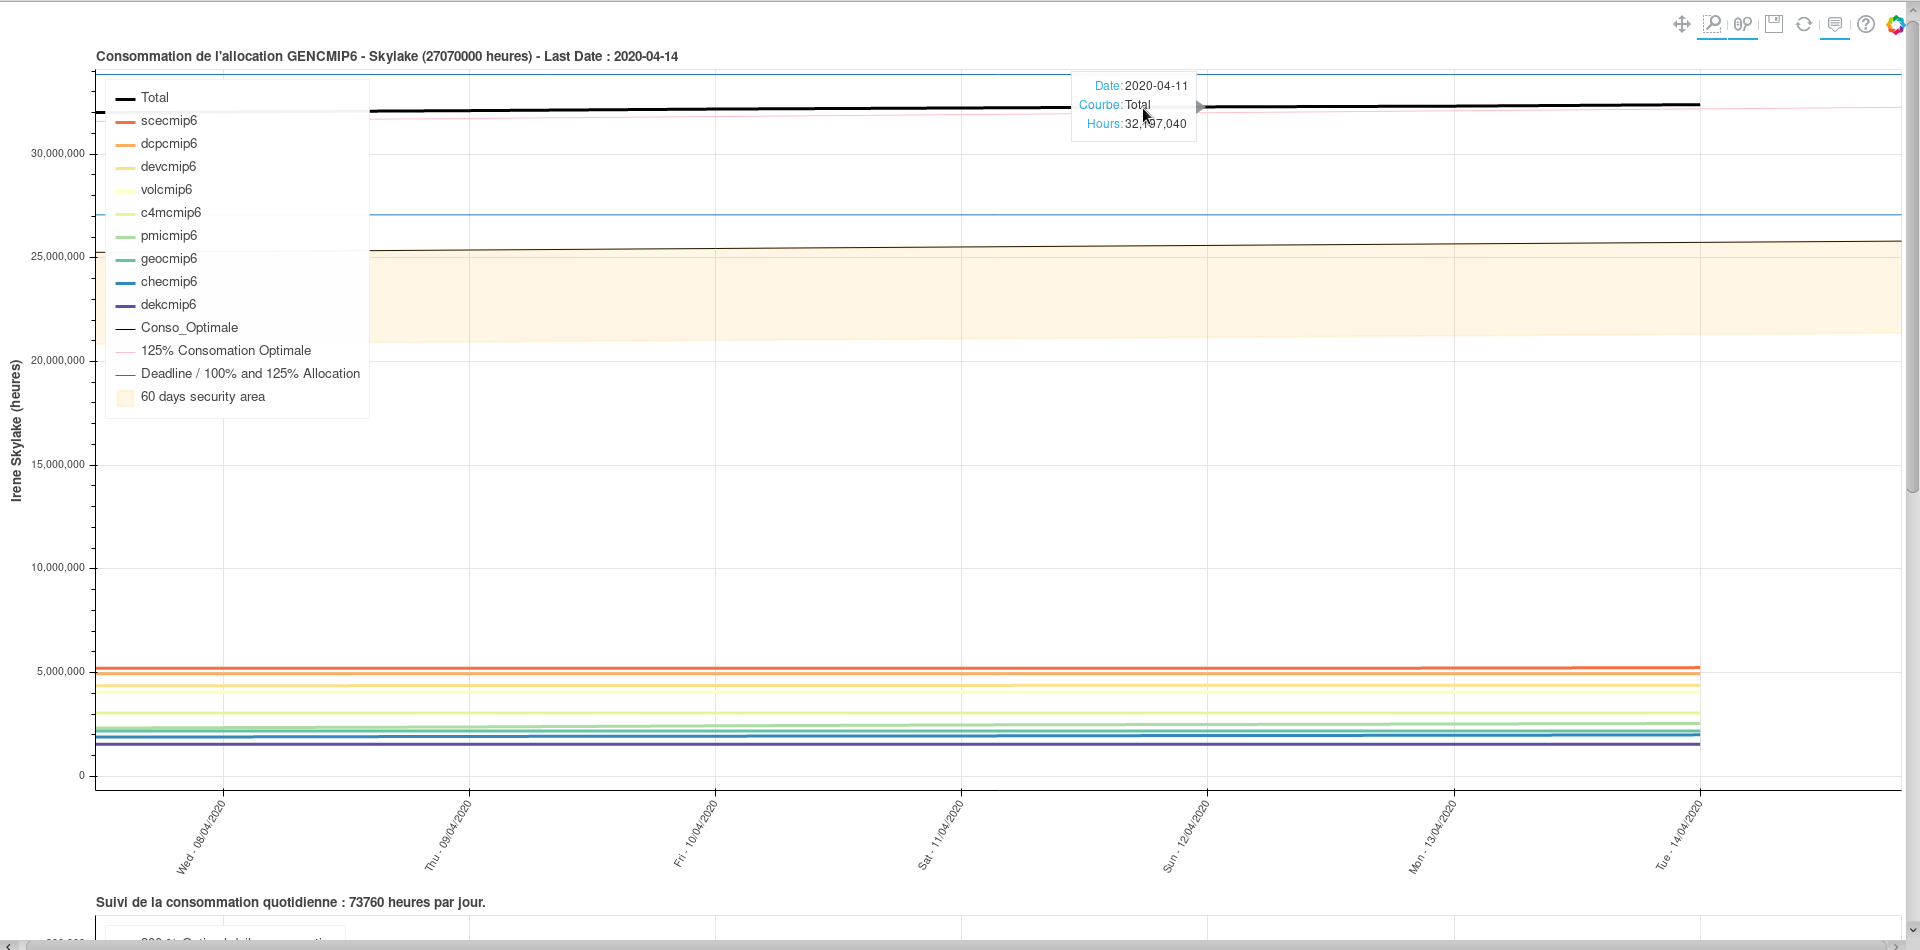
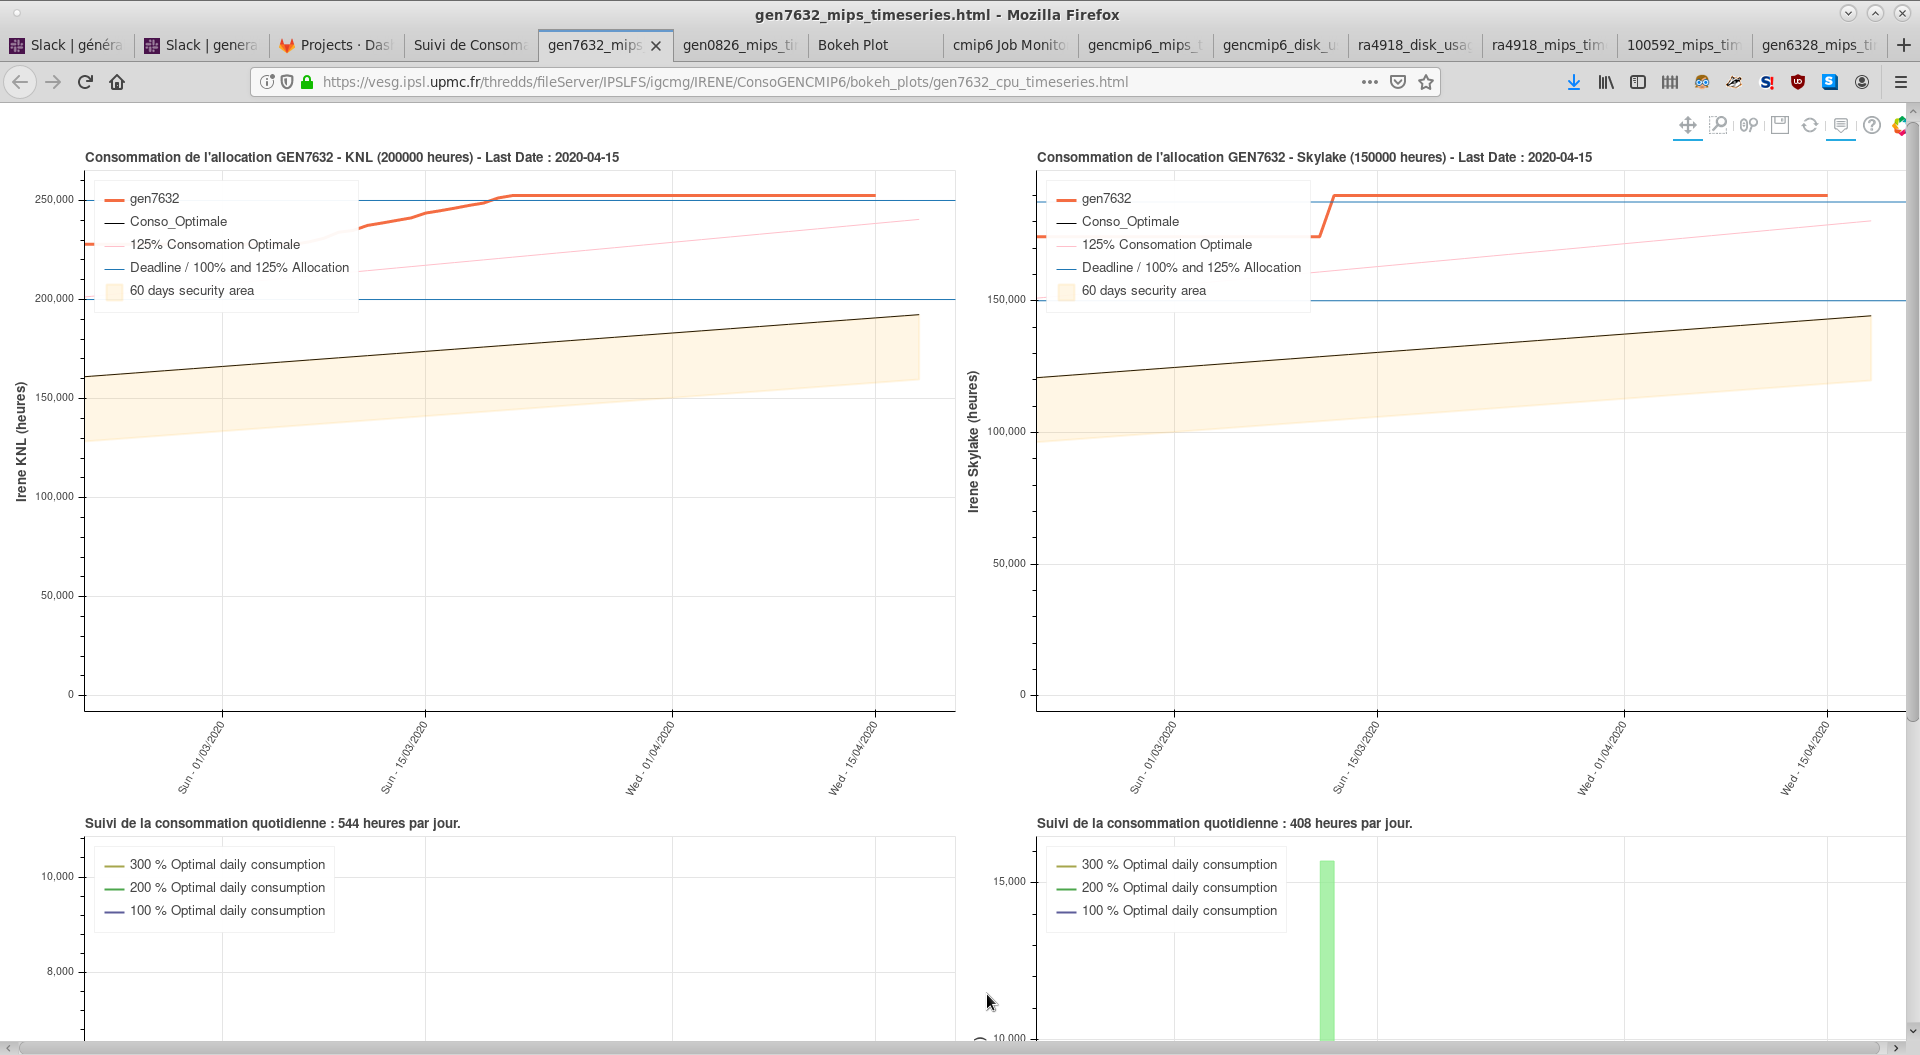
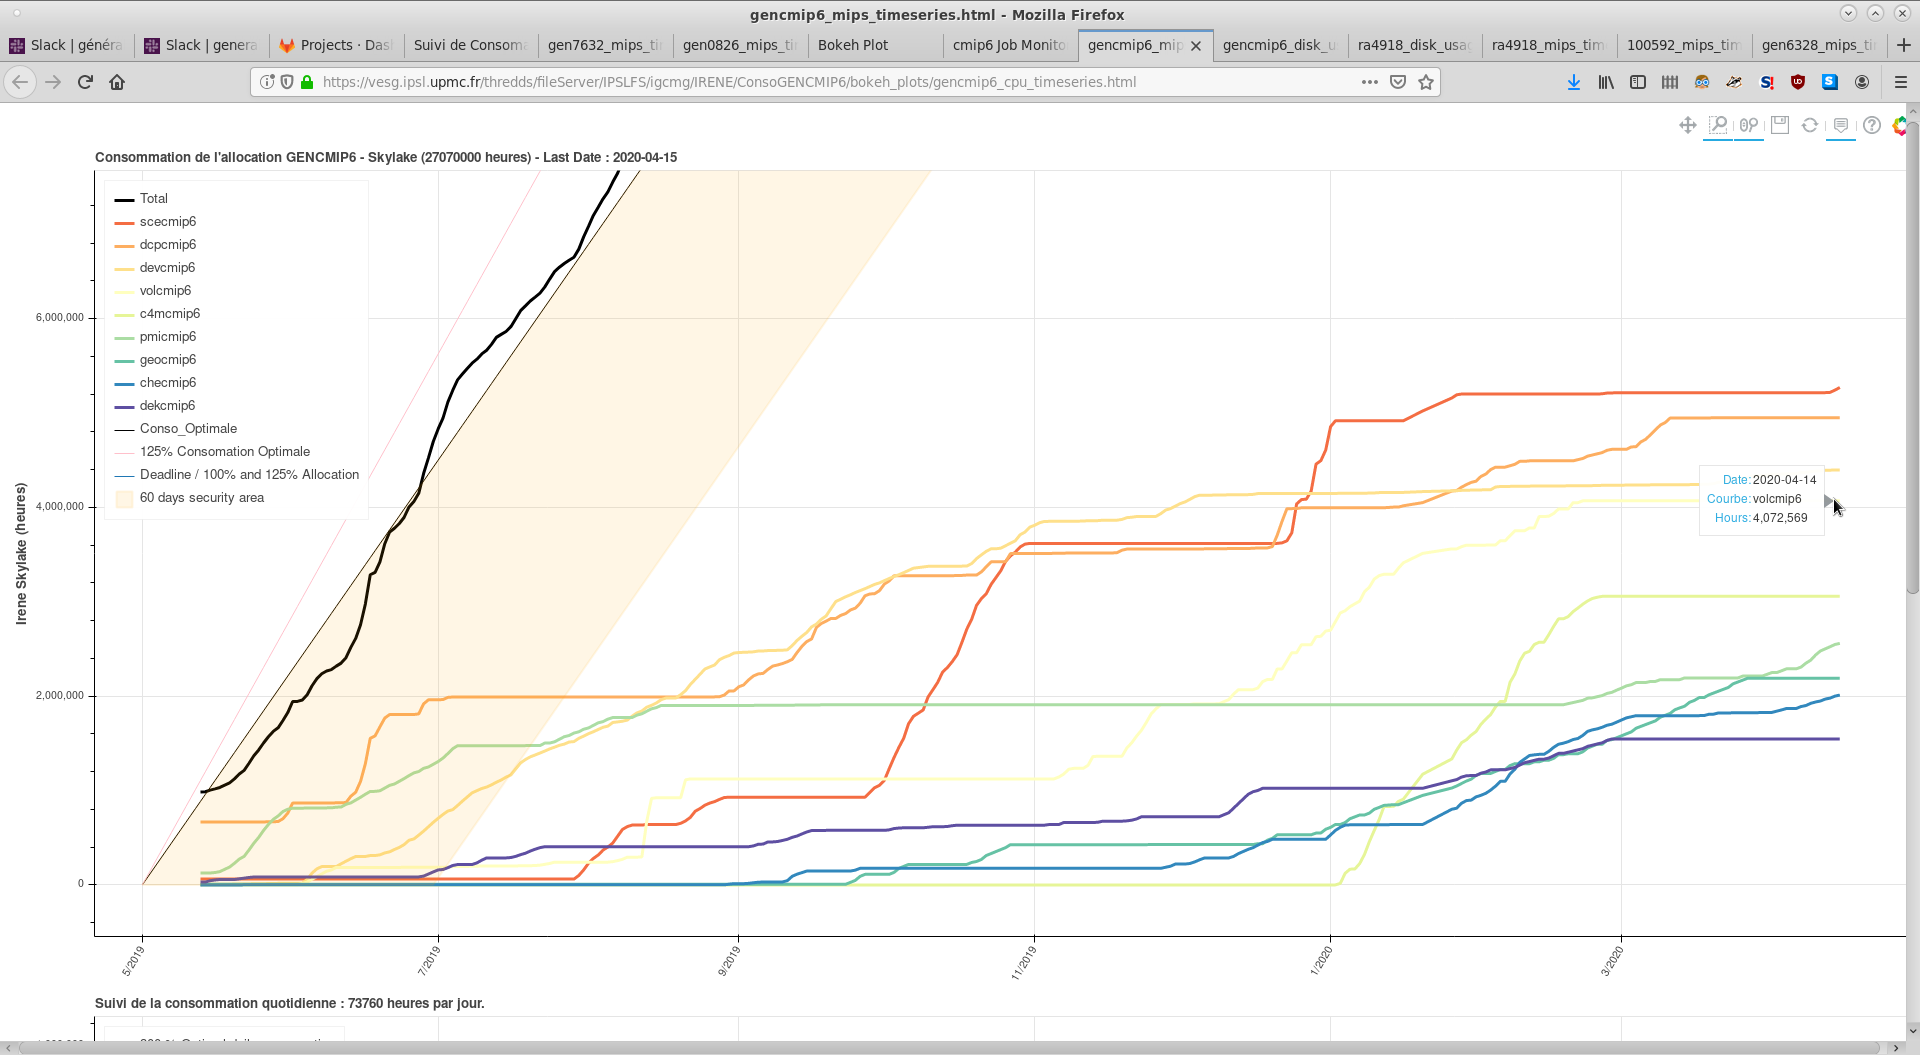
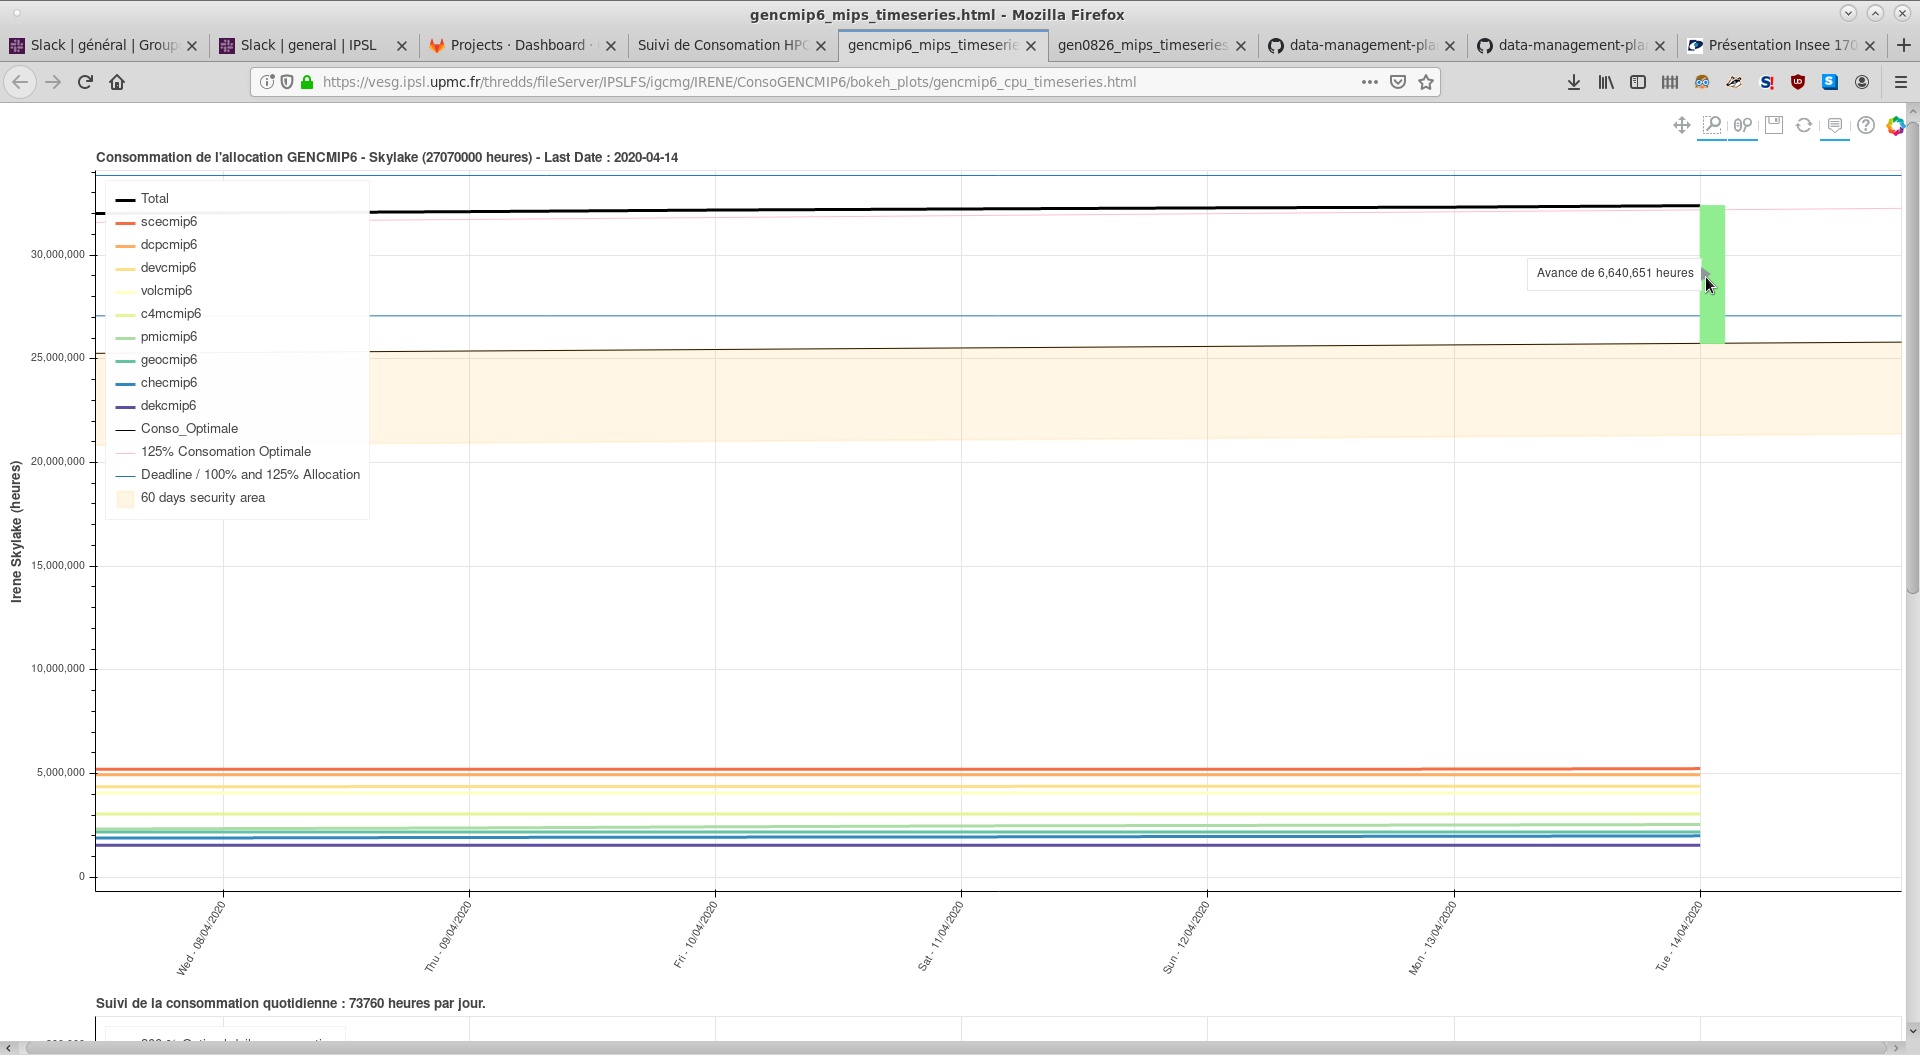
The cpu Consumption Monitoring is available for each each computing project either at IDRIS or TGCC on this page.
The graphs are updated daily.
2. Data Management Tools
Documentation is here
Monitoring :
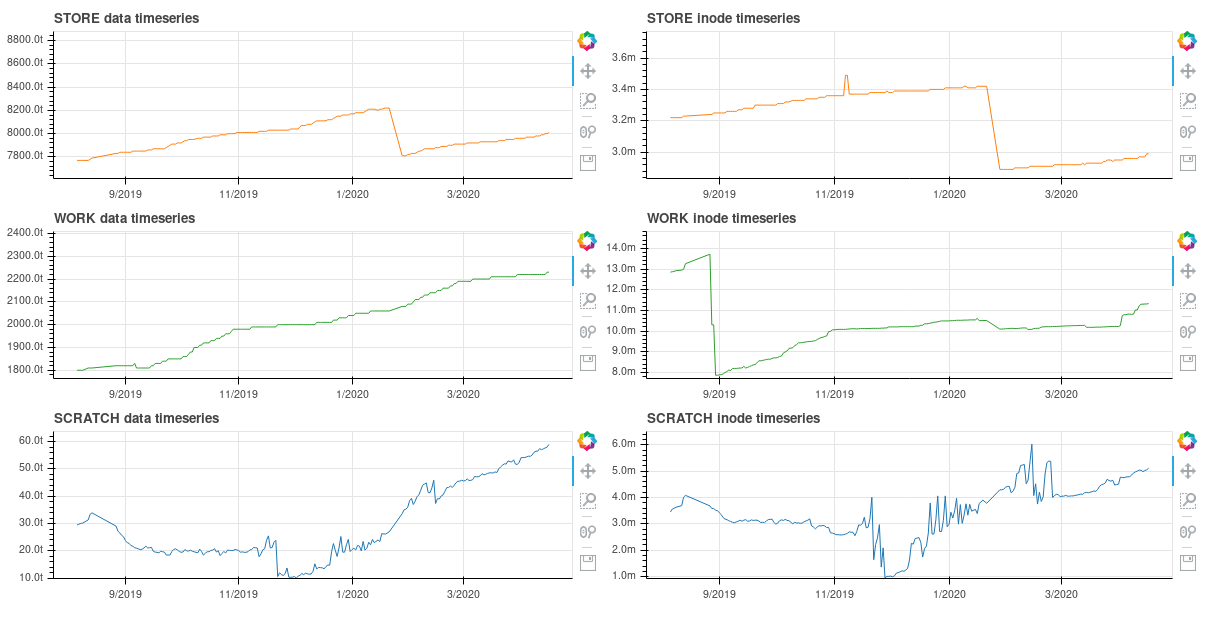
So far, the STORE/WORK/SCRATCH per-project usage monitoring is available on demand. It provides daily update curves displaying the aggregated volume of data and total number of inodes for a given project as a timeseries. Curves will be available at https://vesg.ipsl.upmc.fr/thredds/fileServer/IPSLFS/igcmg/IRENE/ConsoGENCMIP6/index.html on the link "Stockage [...] TIMESERIES"
Cleaning :
The cleaning tool consists in a diagnostic application to help the user assess which of their directories have the most data or takes the most inodes. Thanks to the tool, the user can more easily select what experiments they want to delete and download a path list to delete manually on the computing center. The tool is still under development. A beta version is available on demand. Ask edupont at ipsl.fr for it.
Attachments (9)
- zoom_select.png (129.6 KB) - added by edupont 4 years ago.
- reset.png (709 bytes) - added by edupont 4 years ago.
- quotas_monitoring_gencmip6.png (73.9 KB) - added by edupont 4 years ago.
- hover_bar0.png (49.9 KB) - added by edupont 4 years ago.
- hover0.png (77.2 KB) - added by edupont 4 years ago.
- gen7632.png (127.6 KB) - added by edupont 4 years ago.
- hover_name.png (187.4 KB) - added by edupont 4 years ago.
- hover_avance.png (113.5 KB) - added by edupont 4 years ago.
- title.png (5.4 KB) - added by edupont 4 years ago.
Download all attachments as: .zip
