| Version 16 (modified by klaurent, 9 months ago) (diff) |
|---|
Intermediate conclusions
-
Intermediate conclusions
- Present day simulations to compare with Prather's article
- Lifetime values on different simulations
- Configurations to use for the coupling with PISCES
- Reconstruction of anthropogenic N2O emissions in pre industrial
- Emissions
- Pre industrial run
- CEDS emissions for N2O (and NH3)
- EDGAR emissions
- Exploration of inventories
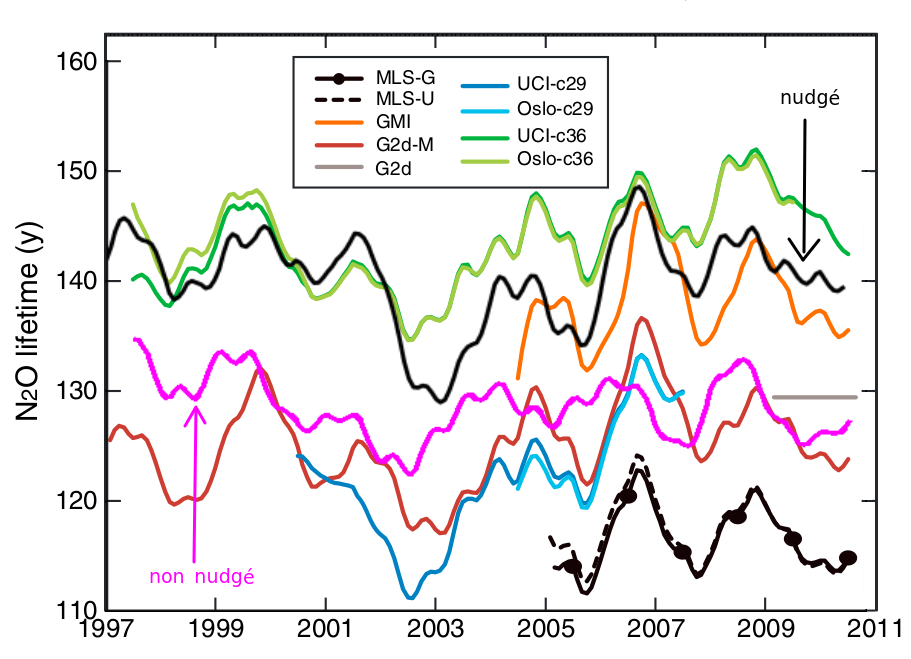
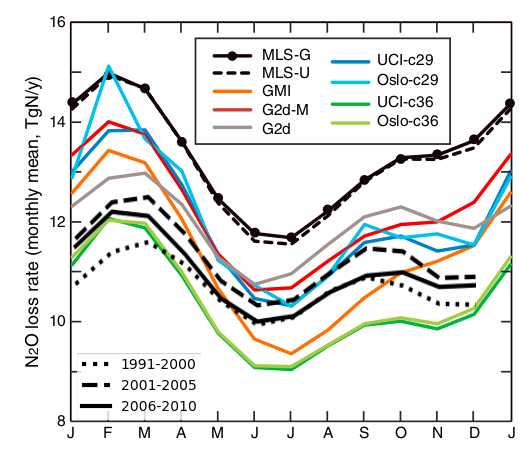
Present day simulations to compare with Prather's article
- Run from 1990 to 2015 (slight spin-up + period of comparison)
- Started in 1990 with our emissions, oxydants from Yann, no nudge and no ozone guide.
- after 10 years of simulation: lifetime at 150 years, burden of 1530 TgN/yr and total loss of 12TgN/y.
Multiple tests done from 2000 (in order to be as close as possible to Prather's results)
| Name | continued | restart.prather.2000 | climoz.nudge | aero.forc.cloz.nudg | lessEmi | physiqNPv6.2 | actuel | overrule Yann | config Yann |
| Copy from | prather.comparison | prather.comparison | restart | climoz | aerosol | aerosol | aerosol | aerosol | aerosol |
| What have changed ? | nothing | nudge (ok_guide=n=>y) | read_climoz=n=>y | flag_aerosol + ok_aie ok_ade | in code: put 0.8*tot_emi | physiq | ConfigType? | restarts | many things |
| Results | lft 138 yr | lft 108 yr | lft 101 yr | lft 100 yr | lft 100 yr | lft 100 yr | lft 101 yr | lft | lft |
| (year 2000) | burden 1525 TgN/y | burden 1525 TgN/y | burden 1523 TgN/y | burden 1523 TgN/y | burden 1523 TgN/y | burden 1523 TgN/y | burden 1523 TgN/y | burden TgN/y | burden TgN/y |
| tot loss 11 TgN/y | tot loss 14 TgN/y | tot loss 15 TgN/y | tot loss 15 TgN/y | tot loss 15 TgN/y | tot loss 15 TgN/y | tot loss 15 TgN/y | tot loss TgN/y | tot loss TgN/y |
The high value of lifetime comes from an high value of total loss, especially loss by photolysis in the stratosphere. This can be due to the amount and/or transport of ozone in the stratosphere. Moreover, we have seen a high concentration of N2O at 10hPa in the high latitudes (South), occurring in May/June?.
The nudging seems to affect too much the transportation. However, other configurations with nudging (CovidRef?, CM5A2*, Rescaled-79-washout,..) don't have this problem. All are NMHC_AER_S configuration, and not GES.
Lifetime values on different simulations
| - | Run of Yann | preindus.off | 39L(L39.v03) | 39L (piscideeL) | preindus.c79 | OxydantsYann? (1850) | OxydantsYann? (1857) | oxYann.newpht (1850) |
| lifetime | 191,86 | 160,59 | 129,05 | 129,33 | 159,28 | 156,86 | 146,33 | 137,858 |
| burden | 1570,97 | 1343,02 | 1364,54 | 1368,25 | 1343,08 | 1342,9 | 1359,17 | 1335,6 |
| loss tot | 8,18 | 8,36 | 10,58 | 10,57 | 8,43 | 8,56 | 9,28 | 9,68 |
| loss o1d | 1,017 | 1,163 | 1,136 | 1,13 | 1,00 | 0,95 | 1,01 | 1,24 |
| loss pho | 7,17 | 7,2 | 9,43 | 9,44 | 7,43 | 7,61 | 8,27 | 8,45 |
| photorate | 7,02E-09 | 6,99E-09 | 6,65E-09 | 6,64E-09 | 7,03E-09 | 7,88E-09 | 7,90E-03 | 7,85E-09 |
| o1d | 3,25E-10 | 5,63E-11 | 2,80E-10 | 3,25E-10 | 3,25E-10 | 3,78E-10 |
- Run of Yann: The one use for the restart Rescaled-79-washout,
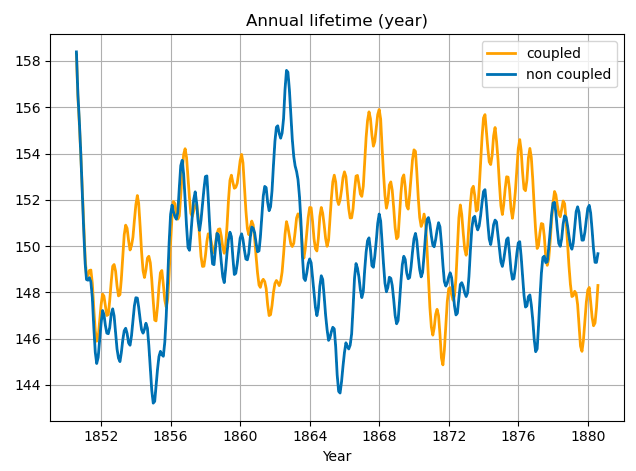
- preindus.off and preindus.c79: coupled and non coupled version for preindustrial period,
- 39L (L39.v03 and piscideeL): reference run in 39 levels,
- OxydantsYann?: same run as preindus.off but with oxydant of Yann's run,
- oxYann.newpht: same run as preindus.off but with new phototable and photorate + oxydants of Yann.
Configurations to use for the coupling with PISCES
We decide to go step by step:
- Use IPSLCM6.3_work with the original files/config. (maybe at this stage, update ORCHIDEE 3)
- Test INCA version with GES configuration,
- Implement in INCA the development I've made,
- Test coupling INCA + DMS Thibaut,
- Develop the transfert of N2O fluxes between PISCES and INCA.
Once everything above is done, we could move to IPSLCM7 with NEMO 4 and new ORCHIDEE (3 or 4?).
Reconstruction of anthropogenic N2O emissions in pre industrial
- from 1850 to 1969: proxy with NMVOC and linear regression, only total emissions per region (no information about sectors);
- from 1850 to 1969: reconstruction per region using 1970's emissions as reference;
- from 1970 to 1999 (extended to 2019): reconstruction per region and sector, using 2000's emissions as reference. (+modification of agriculture sector by factor 0.40 in order to drop soil emissions.)


Remark: A slight difference exists between data from csv file and data in netCDF file; it can be shown with the comparison of 'Notebooks/N2O_sector_country_via_ncfile_maks.csv' (data from netCDF file) and 'Notebooks/total_em_CEDS_sector_country_1970_2019_repartEDGAR2.csv'. This might be due to the maks used...
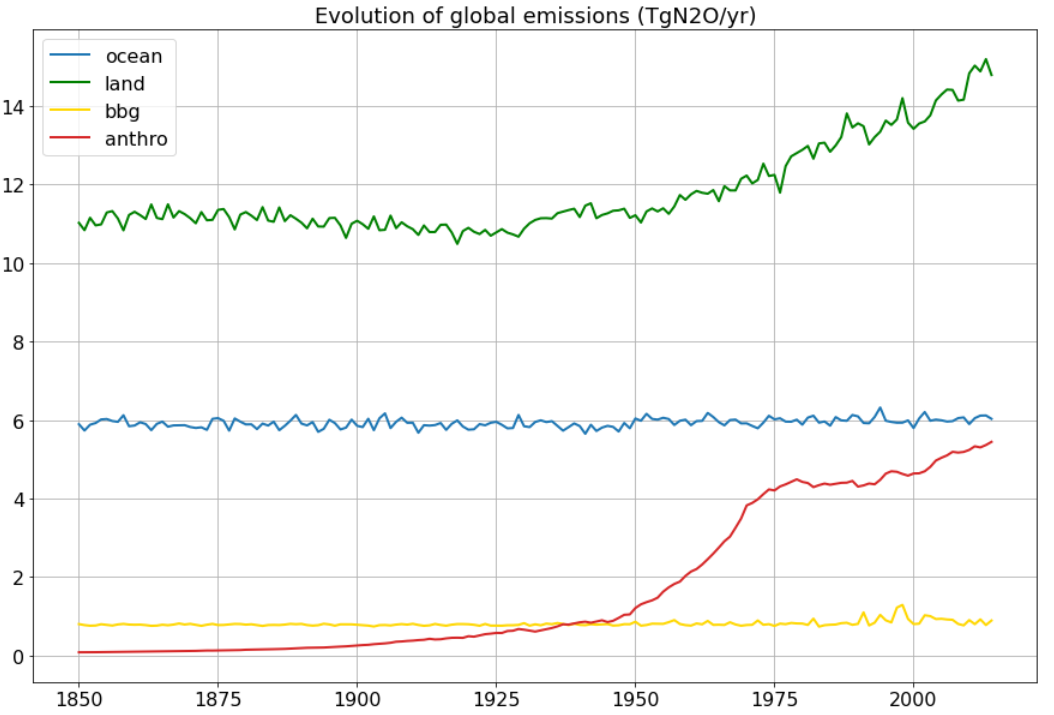
Emissions
- Land: from 7 TgN/Yr to 9.5 TgN/yr (increasing from 1930) => from 11 TgN2O/yr to 15 TgN2O/yr
- Ocean: 3.75 TgN/yr => 6 TgN2O/yr
- BBG: 0.5 TgN/yr => 0.8 TgN2O/yr
- Anthro: from 0 to 3.75 TgN/yr => from 0 to 5.5 TgN2O/yr


Pre industrial run
Some miscellaneous characteristics:
- GES configuration,
- 39 vertical layers, resolution 144x142,
- from fictives years 1970 to 2015,
- no anthropogenic emissions,
- BBG emissions stayed at 1850 (as well as aircraft).
Quantities to remember:
- Total N2O loss: 10.73 TgN/y
- Total N2O emissions: 10.73 TgN/y
- Burden : 1368 TgN


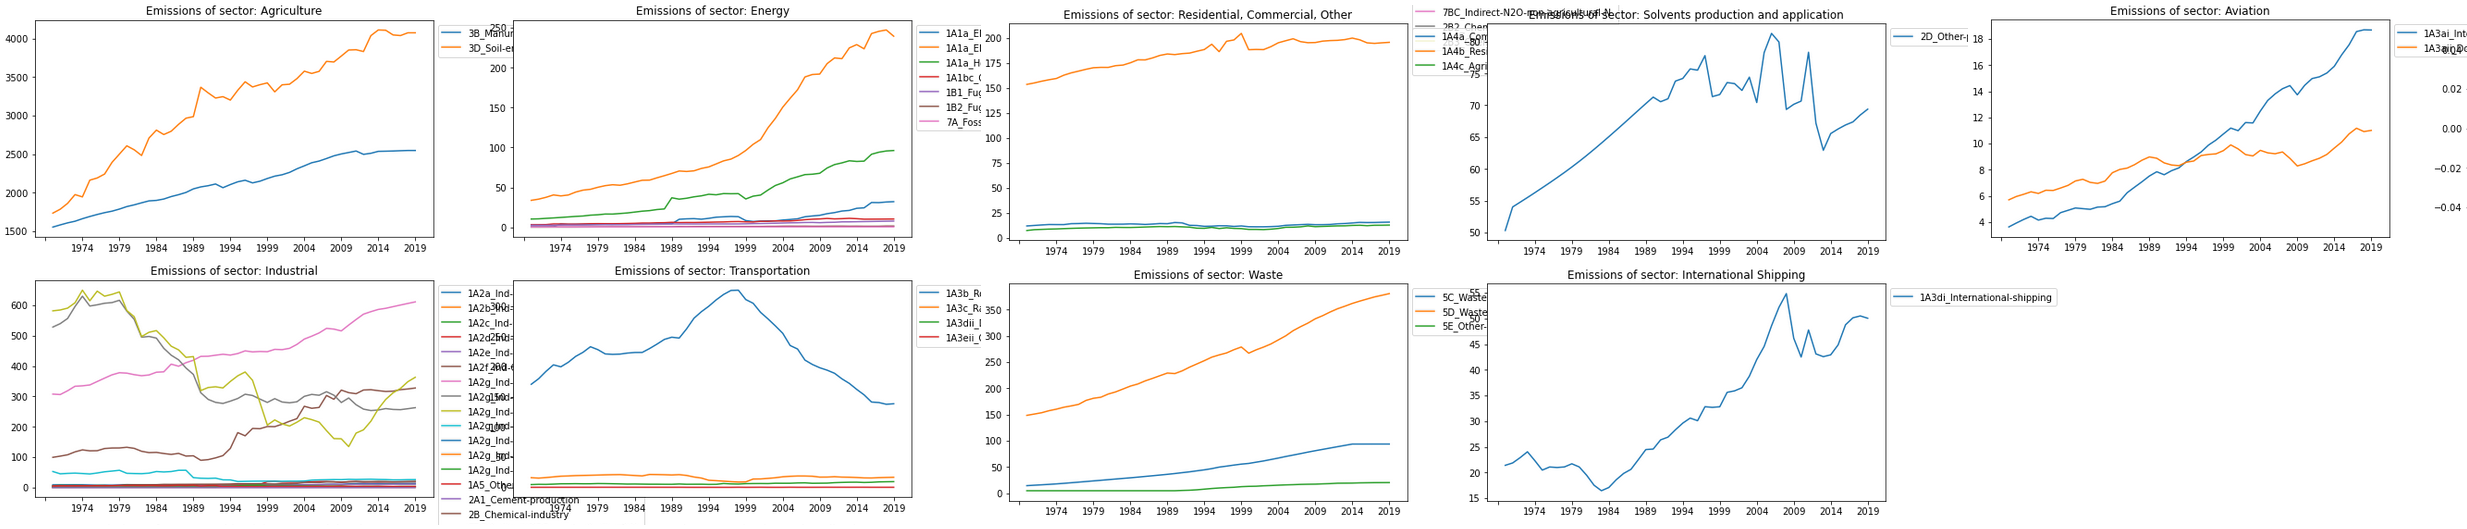
CEDS emissions for N2O (and NH3)


List of categories and subcategories:
- Agriculture: ['3B_Manure-management', '3D_Soil-emissions']
- Energy: ['1A1a_Electricity-autoproducer', '1A1a_Electricity-public', '1A1a_Heat-production', '1A1bc_Other-transformation','1B1_Fugitive-solid-fuels', '1B2_Fugitive-petr', '7A_Fossil-fuel-fires']
- Industrial: ['1A2a_Ind-Comb-Iron-steel', '1A2b_Ind-Comb-Non-ferrous-metals', '1A2c_Ind-Comb-Chemicals', '1A2d_Ind-Comb-Pulp-paper', '1A2e_Ind-Comb-Food-tobacco', '1A2f_Ind-Comb-Non-metalic-minerals', '1A2g_Ind-Comb-Construction', '1A2g_Ind-Comb-machinery','1A2g_Ind-Comb-mining-quarying', '1A2g_Ind-Comb-other','1A2g_Ind-Comb-textile-leather', '1A2g_Ind-Comb-transpequip','1A2g_Ind-Comb-wood-products','1A5_Other-unspecified', '2A1_Cement-production', '2B_Chemical-industry', '7BC_Indirect-N2O-non-agricultural-N', '2B2_Chemicals-Nitric-acid', '2B3_Chemicals-Adipic-acid']
- Transportation: ['1A3b_Road', '1A3c_Rail','1A3dii_Domestic-navigation', '1A3eii_Other-transp']
- Residential, Commercial, Other: ['1A4a_Commercial-institutional', '1A4b_Residential', '1A4c_Agriculture-forestry-fishing']
- Solvents production and application: [ '2D_Other-product-use' ]
- Waste: ['5C_Waste-combustion', '5D_Wastewater-handling', '5E_Other-waste-handling']
- Int. Aviation / Shipping ['1A3di_International-shipping', '1A3ai_International-aviation', '1A3aii_Domestic-aviation']
NB: It exists also some other subcategories but, there are zero N2O emission.

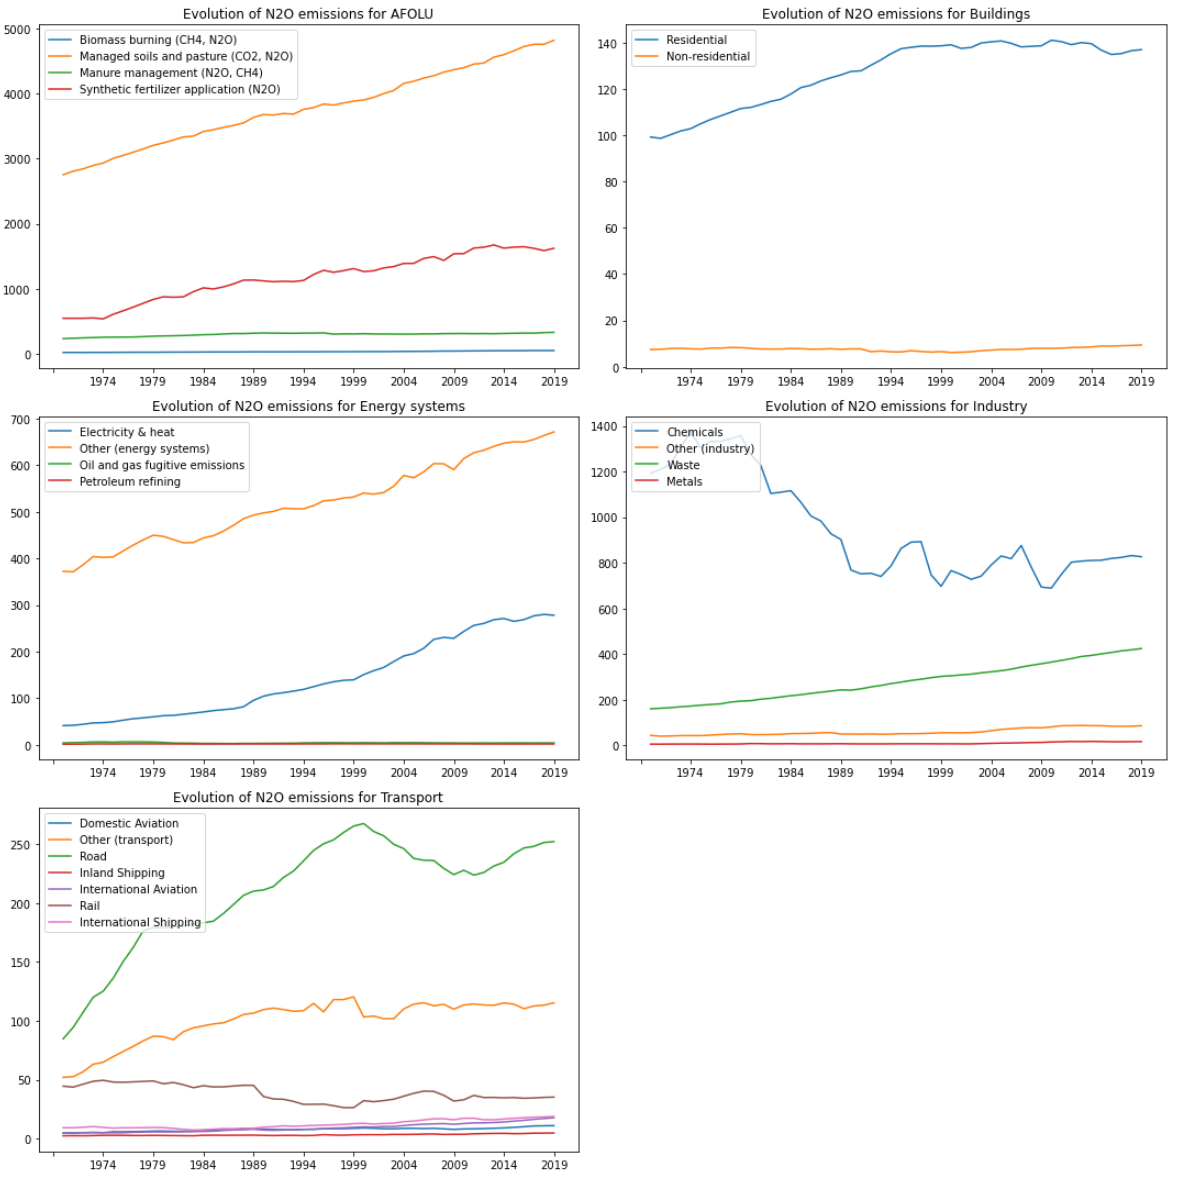
EDGAR emissions
List of categories and subcategories:
- AFOLU : ['Biomass burning (CH4, N2O)', 'Managed soils and pasture (CO2, N2O)', 'Manure management (N2O, CH4)', 'Synthetic fertilizer application (N2O)']
- Buildings : ['Residential', 'Non-residential']
- Energy systems : ['Electricity & heat', 'Other (energy systems)', 'Oil and gas fugitive emissions', 'Petroleum refining']
- Industry : ['Chemicals', 'Other (industry)', 'Waste', 'Metals']
- Transport : ['Domestic Aviation', 'Other (transport)', 'Road', 'Inland Shipping', 'International Aviation', 'Rail ', 'International Shipping']

Exploration of inventories
- Bouwman Inventory :
- 846 N2O emission measurements in agricultural fields and 99 measurements for NO emissions
- The data set includes literature reference; location of the Measurement; climate; soil type, texture, organic C content, N content, drainage, and pH; residues left in the field; crop; fertilizer type; N application rate; method and timing of fertilizer application; NH4+ application rate (for organic fertilizers), N2O/NO emission/denitrification (expressed as total over the measurement period, as % of N rate, and as % of N rate accounting for control); measurement technique; length of measurement period; frequency of the measurements; and additional information, such as year/season of measurement, information on soil, crop or fertilizer management, specific characteristics of the fertilizer used, and specific weather events important for explaining the measured emissions.
- global gridded (1°x1° resolution) data bases of soil type, soil texture, NDVI (vegetation indices) and climate.
- global emission thus calculated is 6.8 Tg N2O-N y-1. The tropics (± 30° of the equator) contribute 5.4 Tg N2O-N y-1 and the emission from extra-tropical regions (poleward of 30°) is 1.4 Tg N2O-N y-1 .
- Transcom Inventory :
- "Emissions from natural soils (6–7 TgN yr −1 ) account for 60–70 % of global N2O emissions (Syakila and Kroeze, 2011; Zaehle et al., 2011). The remaining 30–40 % of emissions is from oceans (4.5 TgN yr −1 )"
- Five different inversion frameworks (chemistry transport model) : MOZART4 (2.5° × 1.88°), ACMt42167 (2.8° × 2.8°), TM3 (5.0° × 3.75°), TM5 (6.0° × 4.0°), LMDZ4 (3.75° × 2.5°).
- Data set from Orchidee O-CN, Pisces, edgar-4.1, gfed-2 and from different category (terrestrial biosphere, ocean, waste water, solid waste, solvents, fuel prod, ground transport, industry combustion, residential and other combustion, shipping, biomass burning)
- Values of N2O emissions per inventory :
| (MtN/yr) | Ocean | Land | Total | (MtN2O/yr) | Ocean | Land | Total |
| Bouwman | 3.595 | 7.531 | 11.126 | xxx | 5.650 | 11.835 | 17.485 |
| Transcom | 4.222 | 10.573 | 14.795 | xxx | 6.634 | 16.614 | 23.248 |
| Piscidee | 3.962 | 7.107 | 11.069 | xxx | 6.226 | 11.168 | 17.394 |
- Comparison between Incasflx outputs and masks on NetCDF files:
| - Output INCASFLX - | - Notebook computing (FracMask?) - | - Notebook computing (0/1 Mask) - | |||||||
| (MtN2O/yr) | Ocean | Land | Ratio O/L | Ocean | Land | Ratio O/L | Ocean | Land | Ratio O/L |
| Bouwman | 5.6505 | 11.835 | 0.478 | 6.58 | 10.945 | 0.6012 | 5.973 | 11.552 | 0.517 |
| 32.3% | 67.7% | 37.6% | 62.4% | 34.1% | 65.9% | ||||
| Transcom | 6.634 | 16.614 | 0.399 | 8.879 | 14.421 | 0.616 | 8.118 | 15.184 | 0.535 |
| 28.5% | 71.5% | 38.1% | 61.9% | 34.8% | 65.2% | ||||
| Piscidee | 6.226 | 11.168 | 0.557 | 6.651 | 10.782 | 0.617 | 6.095 | 11.339 | 0.538 |
| 35.8% | 64.2% | 38.2% | 61.8% | 34.9% | 65.1% | ||||
General remarks: Variable for Bouwman = fn2o_oce & fn2o_soil. Land emissions > Ocean emissions. Ocean emissions ~ 6 Mt/yr. Land emissions -> differences because of different period (pre-industrial & nowadays). Per line, Ocean+Land are equal independently of the calculation made.
Attachments (13)
- EDGAR_emissions.png (237.1 KB) - added by klaurent 20 months ago.
- CEDS_emissions.png (359.7 KB) - added by klaurent 20 months ago.
- global_em_N2O_accumulated.png (115.5 KB) - added by klaurent 19 months ago.
- global_em_N2O_alone.png (120.5 KB) - added by klaurent 19 months ago.
- global_em_alone_TgN.pdf (19.2 KB) - added by klaurent 19 months ago.
- global_em_accumulated_TgN.pdf (21.4 KB) - added by klaurent 19 months ago.
- global_em_alone_TgN.png (75.6 KB) - added by klaurent 19 months ago.
- global_em_accumulated_TgN.png (76.4 KB) - added by klaurent 19 months ago.
- final_em.png (48.1 KB) - added by klaurent 19 months ago.
- final_em_sect.png (364.6 KB) - added by klaurent 19 months ago.
- figure5_2spinup.png (170.0 KB) - added by klaurent 7 months ago.
- figure4_.png (105.4 KB) - added by klaurent 7 months ago.
- preindus_lifetimes.png (76.8 KB) - added by klaurent 7 months ago.
Download all attachments as: .zip